Bidding Considerations for AR5
Headwinds for Offshore Wind Projects
-
June 16, 2023
DownloadsDownload Article
-
The UK wants to maintain its historical lead in the offshore wind (“OSW”) industry with a stated ambition to develop 50 GW of capacity by 2030.1 However, the soaring cost of capital, inflation and supply chain issues threaten to derail this goal. In light of these challenges, it’s likely that project sponsors participating in the Allocation Round 5 (“AR5”) auction faced significant pressure to bid within the maximum Administrative Strike Prices and required very optimistic assumptions in their business cases to achieve acceptable levels of equity returns.
OSW projects will need to stretch their business cases and might require additional government support to remain competitive.
~7% Estimated after-tax equity Internal Rate of Return ("IRR") at financial close for OSW farms using the Administrative Strike Price (“ASP”).
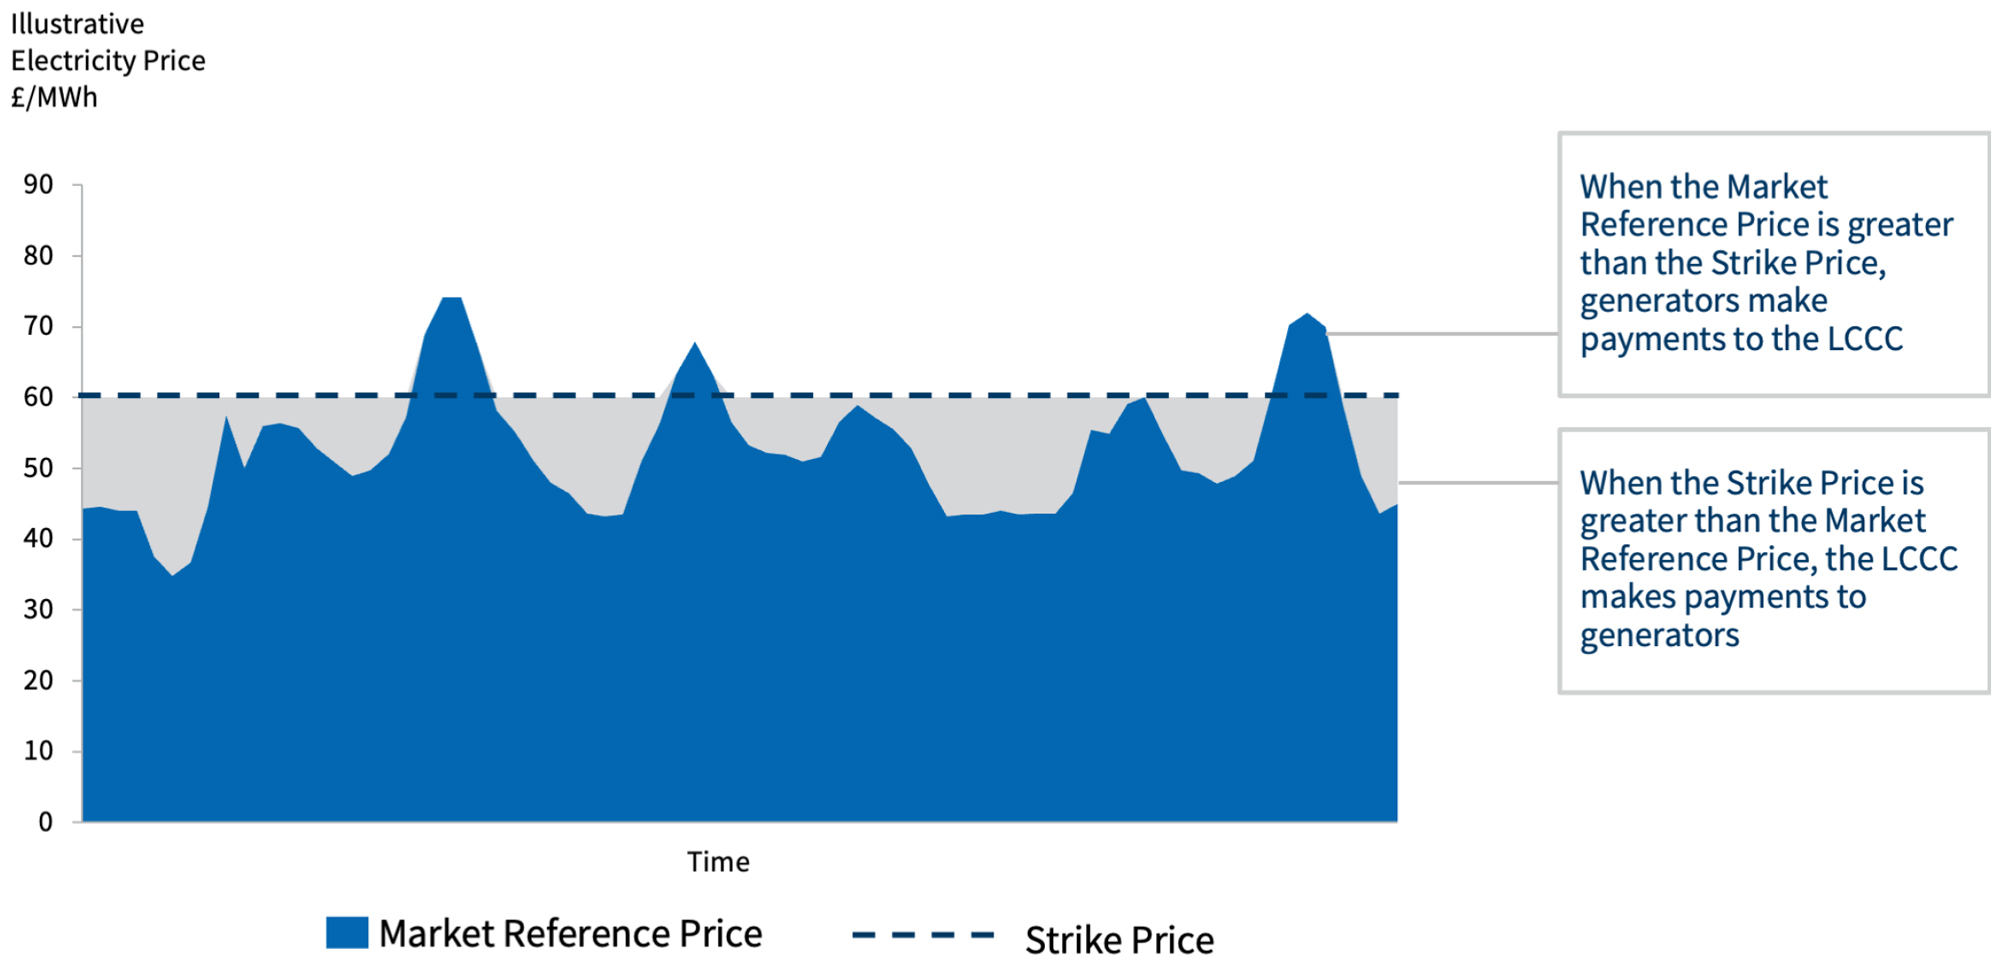
The Contract for Difference (“CfD”) scheme is the UK government’s flagship policy to support the deployment of renewable energy. This scheme aims to spur investment by protecting renewable energy developers from volatile wholesale electricity prices (Market Reference Price) by guaranteeing a fixed price — known as the strike price — for the duration of the contract (15 years). In turn, consumers are also safeguarded from spikes in wholesale electricity prices, as generators will pay back the difference between electricity prices and the contract price in periods of high electricity prices.
Projects participate in the CfD scheme by bidding for these contracts in regular auctions called Allocation Rounds (“ARs”), putting forth their strike price, or the price required from the government to ensure that an economically viable project can be developed. The ARs are now held annually, with different rules established for each auction depending on which technology the government wishes to encourage.
Given that generators only have to manage their volume (or production) risk, the overall risk is naturally reduced.
This risk reduction, coupled with the creditworthiness of the government-backed counterparty (the Low Carbon Contracts Company), enables projects to take on a significant amount of leverage.
In some cases leverage can exceed 70%, with developers seeking the longest possible tenure and most favourable interest rate.
These conditions support increased investment in the sector and enable improved returns, further accelerating the deployment of renewable energy projects.2
In exchange for providing revenue support and risk reduction, the UK aims to reduce the cost of electricity supply by constantly lowering the maximum potential strike price — the Administrative Strike Price (“ASP”) — that projects of a particular technology are allowed to achieve in the ARs. This approach has worked well so far and has stimulated significant cost reductions. But for AR5, this strike price ceiling might have put developers in a tight spot.
Figure 1: Revenue Support Mechanism in the UK: How CFD Contracts Work
Note: Low Carbon Contracts Company ("LCCC").
Source: FTI Consulting.
Industry Perspectives on Cost Pressures
The cost of generating renewable electricity has consistently been reduced over the past decade, across all technologies. However, the combination of soaring cost of capital, inflation and supply chain issues has placed significant upwards pressure on generators’ cost to produce electricity.3 With costs increasing, projects participating in AR5 also required higher strike prices to earn an economically viable rate of return.
The impact of increased costs on developers is already becoming apparent. For example, the owner of Hornsea 3, Ørsted, publicly stated that the project may not go ahead if more public support for the project is not given. Hornsea 3, a 2,800 MW offshore wind farm, was awarded a CfD in July 2022 as part of AR4 at an inflation-index strike price of £37.35/MWh in 2012 prices (or £47.43/MWh in 2022 prices).4
Furthermore, upon the publication of the Budget Notice, which sets out the parameters for AR5, RenewableUK has said that “parameters set for this year’s CfD auction are currently too low and too tight to unlock all the potential investment in wind, solar and tidal stream projects which the industry could deliver.”5 This statement clearly highlights the challenge faced by the AR5 process.
Table 1: Administrative Strike Prices and Delivery Years for Offshore Wind, Onshore Wind and Solar PV (Real 2012 £/MWh)
| Technology | AR1 | AR2 | AR3 | AR4 | AR5 |
|---|---|---|---|---|---|
| Offshore Wind | 155 | 2014-15 155 | 2015-16 150 | 2016-17 140 | 2017-18 140 | 2018-19 |
105 | 2021-22 100 | 2022-23 |
56 | 2023-24 53 | 2024-25 |
46 | 2025-26 46 | 2026-27 |
44 | 2025-26 44 | 2026-27 44 | 2027-28 |
| Onshore Wind | 95 | 2014-15 95 | 2015-16 95 | 2016-17 90 | 2017-18 90 | 2018-19 |
53 | 2023-24 53 | 2024-25 |
53 | 2025-26 53 | 2026-27 53 | 2027-28 |
||
| Solar photovoltaics (PV) | 120 | 2014-15 120 | 2015-16 115 | 2016-17 110 | 2017-18 100 | 2018-19 |
47 | 2023-24 47 | 2024-25 |
47 | 2025-26 47 | 2026-27 47 | 2027-28 |
Note: A delivery year represents the first year when a project can start receiving payments under its CfD contract. Projects have the option to bid into the available delivery years, and different delivery years will have a different impact on the available budget.
Source: CfD Budget Notice, Gov.UK: Round 1, Round 2, Round 3, Round 4, Round 5.
Table 2: Offshore Wind Farms Qualified to Participate in AR5
| Project Name | Developer | Capacity (MW) |
|---|---|---|
| East Anglia One North | Scottish Power |
800 |
| Seagreen 1A | SSE Renewables |
500 |
| Norfolk Vanguard | Vattenfall/Scottish Power |
1,800 |
| East Anglia Two | Scottish Power |
900 |
Note: Projects needed to have secured planning permission before they were qualified to participate in AR5.
Source: Renewable Energy Planning Database ("REPD"): January 2023, Gov.UK (link).
Table 3: Strike Prices Achieved for Offshore Wind, Onshore Wind and Solar PV for Different Delivery Years (Real 2012 £/MWh)
| Technology | AR1 | AR2 | AR3 | AR4 |
|---|---|---|---|---|
| Offshore Wind | 119.89 | 2017-18 114.39 | 2018-19 |
74.75 | 2021-22 57.50 | 2022-23 |
39.65 | 2023-24 41.61 | 2024-25 |
37.35 | 2026-27 |
| Onshore Wind | 79.23 | 2016-17 79.99 | 2017-18 82.50 | 2018-19 |
42.47 | 2024-25 |
||
| Solar PV | 50.00 | 2015-16 79.23 | 2016-17 |
45.99 | 2023-24 45.99 | 2024-25 |
Note: A delivery year represents the first year when a project can start receiving payments under its CfD contract. Delivery years present in Table 1 above but not here imply that no projects bid into those delivery years for the corresponding technology.
Source: Outcome of Allocation Rounds, Gov.UK: Round 1, Round 2, Round 3 and Round 4.
Equity Returns Analysis
When analysing the returns ascribed to the development of renewable power projects, an important metric to consider is the after-tax equity return, also known as the blended equity IRR, which combines returns from both pure equity distributions and shareholder loans. In a typical project decision process, only projects with equity IRRs exceeding a defined hurdle rate will be approved as viable investments.
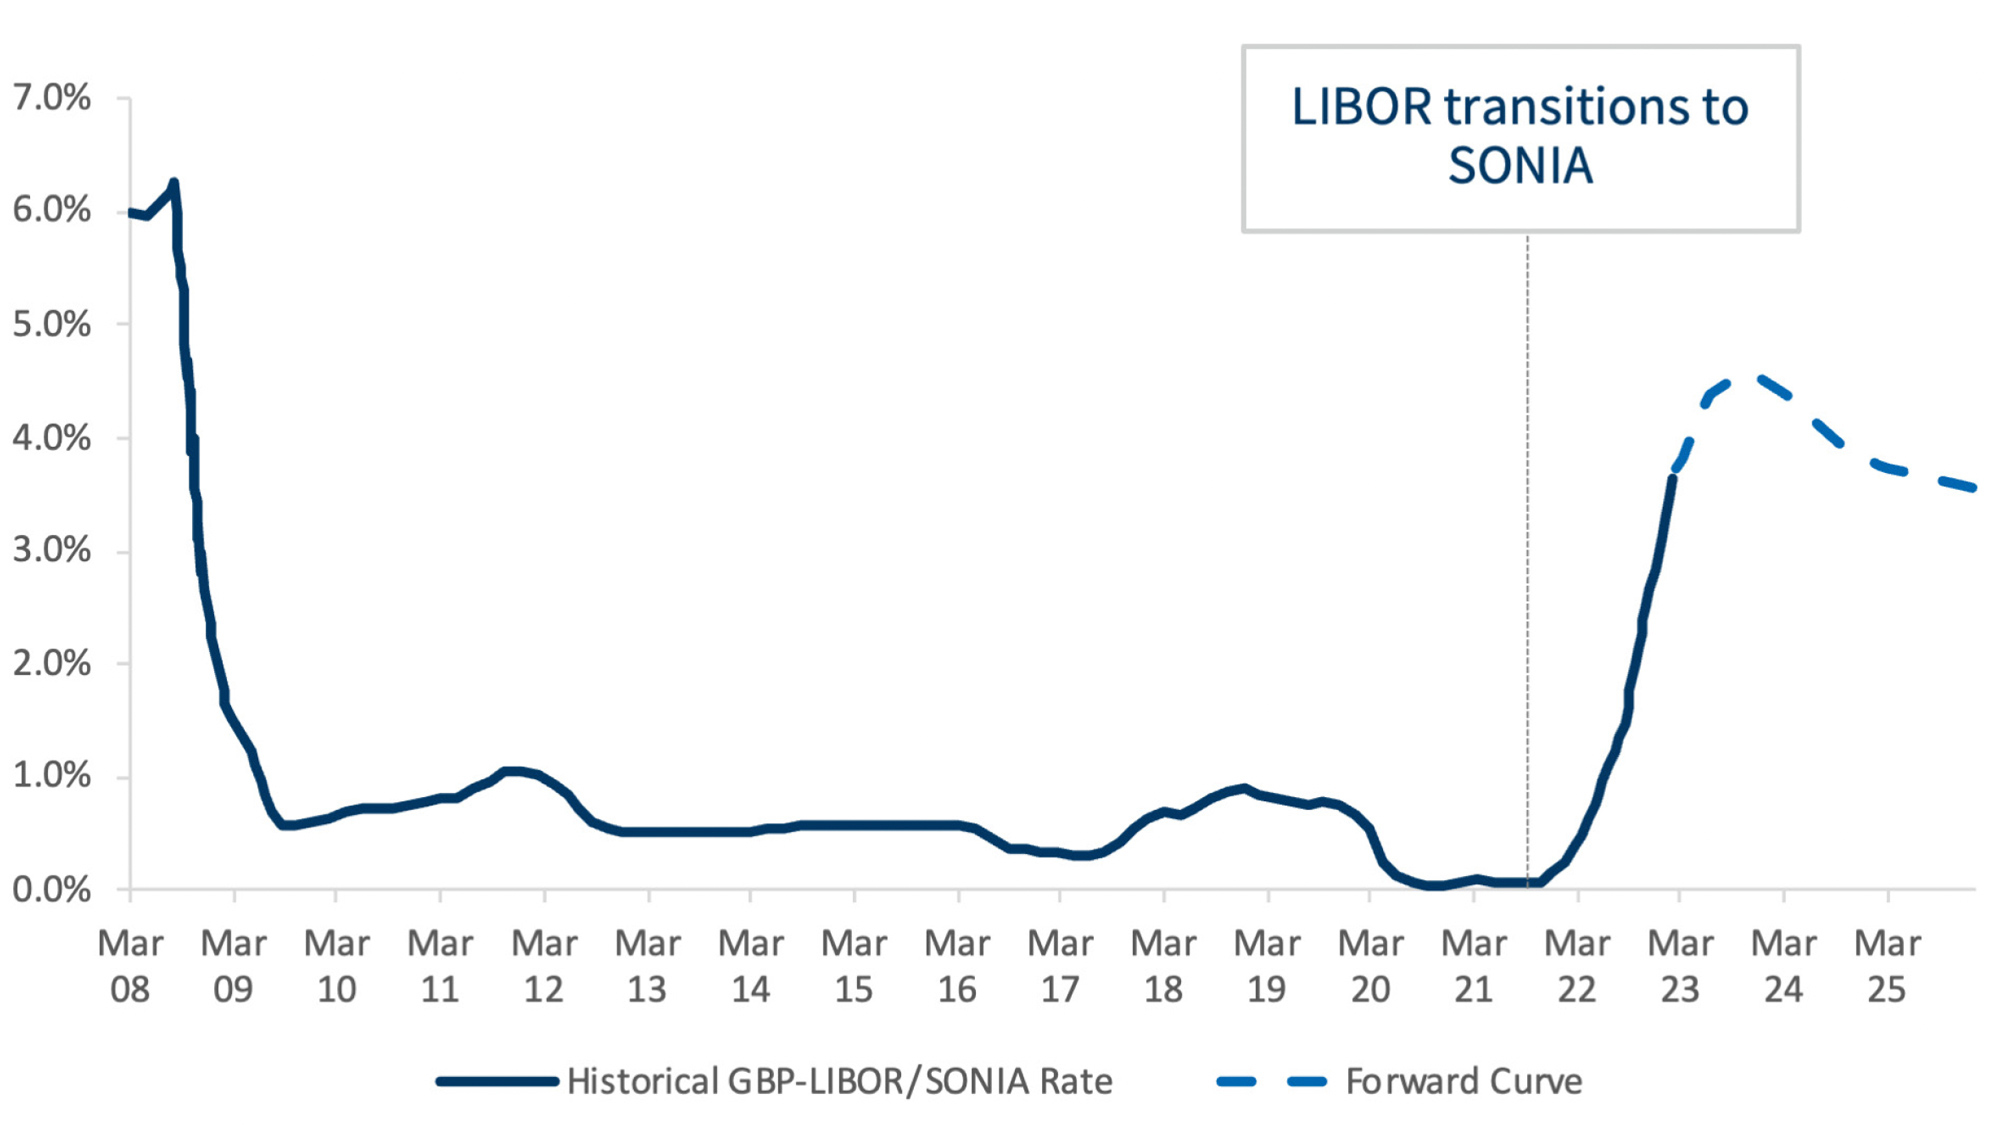
Two of the key drivers of the equity IRR are (i) the capital expenditure and (ii) the cost of capital, both of which have risen over the past 12 months.6,7 The figure below from Chatham Financial shows how the cost of debt has increased sharply over this period.
The struggles of the industry are also seen across the supply chain. Increases in raw materials prices have erased margins at Vestas, a leading manufacturer, installer and servicer of wind turbines, with gross margins tumbling from 10.0% in 2021 to 0.8% in 2022, as reported in its 2022 full year investor presentation.8
Figure 2: Three Month GBP Libor/Sonia Rate and Current Forward Curve
Note: London Inter-Bank Offered Rate ("LIBOR"); Sterling Overnight Index Average ("SONIA").
Source: The hairy chart: Historical accuracy of LIBOR forward curves, Chatham Financial, 31 Mar 23 (link).
Analysis by FTI Consulting indicates that expected returns in this context are well below the usual hurdle rate (10%-12%) that investors demand for projects at the development stage.9 Our view is that prices and interest rates will moderate slightly but will eventually settle at a higher long-term average than the previous decade, as indicated by futures of key raw materials (e.g. steel) and SONIA (Sterling Overnight Index Average) forward curves. For offshore wind projects bidding at the ASP (maximum allowed strike price), in AR5 we estimate an after-tax equity return short of 7% in our base case.10
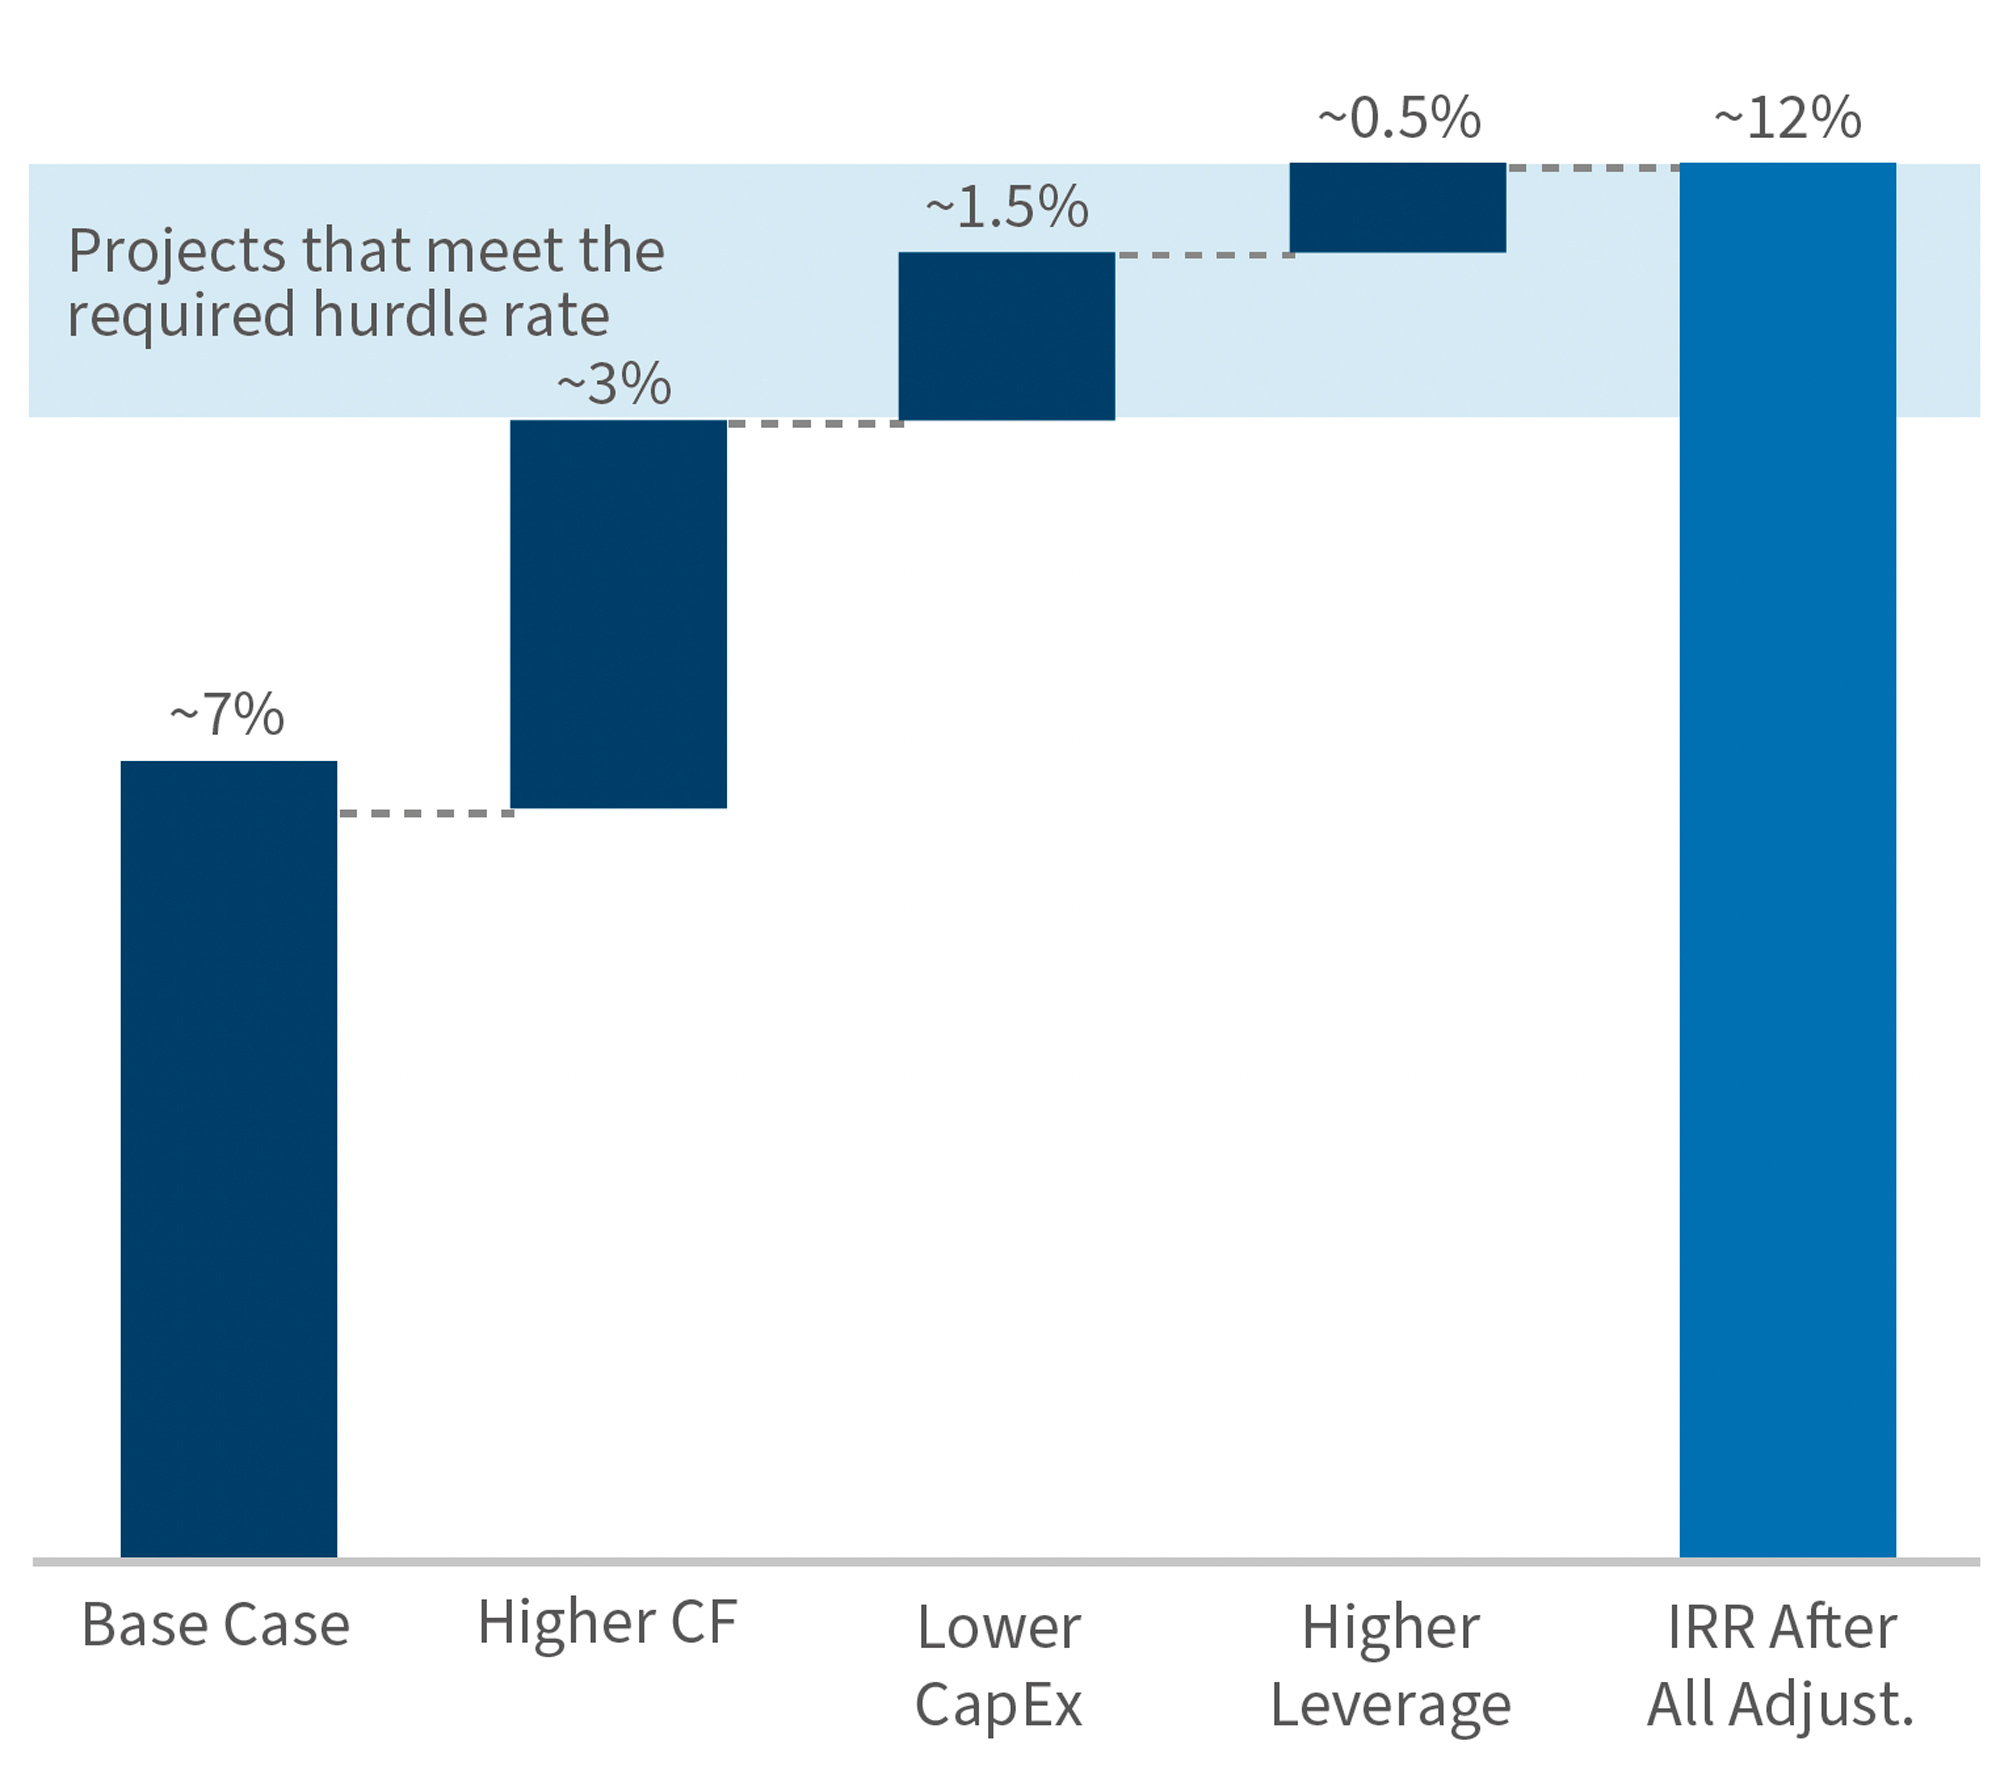
To understand what assumptions would be required for projects to achieve a higher rate of return and improve their business case, we have modelled four scenarios:
- Base Case11
- Higher Capacity Factors (increase of capacity factor to 50%)
- Lower CapEx (10% reduction in CapEx)
- Higher Leverage (increase of debt-to-equity ratio to 80%)
These additional scenarios indicate that projects would have to assume a capacity factor of at least 50% to add another 3% to expected business case returns. Projects would also have to combine an expectation of 10% CapEx reduction and a debt-to-equity leverage of 80% to add another 2% of after-tax equity returns.
While the indicative returns calculated in our scenarios are subject to significant variability, and heavily dependent on the assumptions used, the analysis indicates that, at the current ASPs, offshore wind projects would require very optimistic assumptions in their business cases to remain competitive.
If the UK government wants to achieve its target of 50 GW of offshore wind by 2030, it will have to review how the ASPs are set to avoid a slowdown in renewable project deployments. It is encouraging that a review process of the CfD scheme has already started,12 but the introduction of “non-price factors” needs to be coupled with a better approach for setting future ASPs that takes into account the industry context.
Figure 3: Scenario Analysis: Post-Tax Equity Returns
Note: Returns are calculated incrementally — i.e. subsequent scenarios incorporate adjustments made by previous scenarios.
Source: FTI Consulting.
At a time when there is intense competition with the US and the EU to attract investment in renewable energy, the UK will need to evaluate the best way to continue to provide support and incentivise developers and investors to build the future offshore wind projects to achieve the country’s target to reach net zero by 2050.13
Footnotes:
1: UK signs agreement on offshore renewable energy cooperation, Department for Business, Energy & Industrial Strategy, 18 Dec 2022 (link).
2: Contracts for Difference, Department for Business, Energy & Industrial Strategy, 14 Dec 22 (link).
3: 2H 2022 Levelized Cost of Electricity Update, Bloomberg New Energy Finance, 27 Dec 22 (link).
4: Orsted says huge UK Hornsea 3 wind project at risk without government action, Reuters, 3 Mar 23 (link).
5: Industry urges UK government to revise AR5 budget, Renews.Biz, 16 Mar 23 (link).
6: Rising prices and supply chain risks threaten Europe’s renewable aims, Financial Times, 30 Nov 22 (link).
7: European wind industry “struggling” with rising costs, Financial Times, 11 Oct 22 (link).
8: Vestas FY 2022 Earnings Call Investor Presentation, Vestas, Feb 23 (link).
9: See, for example, Current and Future Costs of Renewable Energy Project Finance Across Technologies, NREL, Jul 20 (link), noting that understanding of risks related to offshore wind projects has increased since the report was published.
10: We have included full expensing in our base case for qualifying capital allowances, as part of measures announced for Budget 2023, to illustrate that further support is required above what is currently being proposed. See here.
11: Our base case usejavascript:void(0);s a capacity factor of c. 45%, CapEx at c. £2.1m/MW, a leverage ratio of c. 70%, and an interest rate using SONIA forward curve plus construction margin of 2.5% and operation margin of 1.5%.
12: Introducing non-price factors into the Contracts for Difference scheme: call for evidence, Department for Energy Security and Net Zero, 17 April 2023 (link).
13: UK Net Zero Strategy policy paper, 19 October 2021 (link).
Published
June 16, 2023
 Key Contacts
Senior Managing Director, Head of South Africa Business Transformation
Managing Director
Downloads
Most Popular Insights
- Beyond Cost Metrics: Recognizing the True Value of Nuclear Energy
- Finally, Pundits Are Talking About Rising Consumer Loan Delinquencies
- A New Era of Medicaid Reform
- Turning Vision and Strategy Into Action: The Role of Operating Model Design
- The Hidden Risk for Data Centers That No One is Talking About


