No Surprises Act
Financial Implications for Emergency Departments
-
January 20, 2022
Downloads Download Article
-

The No Surprises Act legislation requires health insurers to cover emergency services without prior authorization and regardless of health plan network status. Under the legislation, the health plan must cover emergency services as if they were in-network. Patient cost-sharing is based on a “recognized amount,” e.g., 20% co-insurance. In-network deductibles and out-of-pocket maximums apply. Balance billing is prohibited1.
In this article, we explore the financial implications to emergency departments in twenty of the largest Metropolitan Statistical Areas (MSAs). FTI Consulting completed an analysis of two common emergency department codes — 99284, Level 4 visit and 99285, Level 5 visit — that account for most emergency department visits. Levels of care vary based on comprehensiveness of the history and physical examination, and complexity of decision-making. The analysis does not consider the hospital facility fee, which for Levels 3-5 could reach thousands of dollars. The average emergency department visit cost was $1,389 in 20172.
All Healthcare is Local
In our sample, in-network claims accounted for 96.6% of the sample; out-of-network were 3.4%. Out-of-network claims are highest in Texas (Dallas, Houston, Fort Worth) and Tampa, Florida. On a weighted average basis, out-of-network reimbursement was 28%-34% higher than in-network reimbursement.
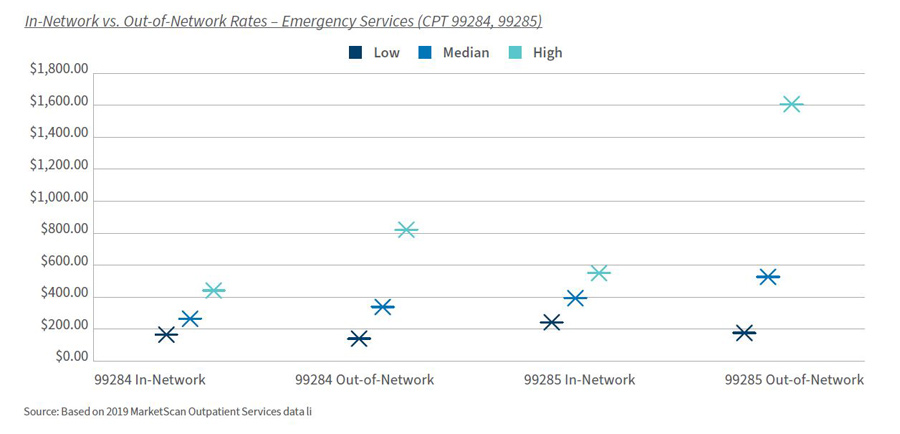
Level 4 Visit: 99284
- In-network 96.7% of claims; out-of-network 3.3%
- In-network median allowed amount: $264.02; range $164.85 to $440.80 (Orlando)
- In-network median as % of Medicare: 205.7%
- Out-of-network median allowed amount: $337.76; range $139.84 to $821.60 (Atlanta)
Level 5 Visit: 99285
- In-network 96.5% of claims; out-of-network 3.5%
- In-network median allowed amount: $393.05; range $242.21 to $549.94 (Dallas, Fort Worth)
- In-network median as % of Medicare: 210.9%
- Out-of-network median allowed amount: $526.38; range $206.39 to $1,607.84 (Washington, D.C.)
Analysis
The No Surprises Act is particularly focused on out-of-network claims. Providers and health plans can no longer bill patients beyond their in-network cost-sharing amount. Collection of the differential will be subject to negotiation and, if unsuccessful, an Independent Dispute Resolution process3.
The fundamental question involves payment for services beyond in-network contracted rates. A regression to the median contracted rate could result in a significant reduction in high-margin revenues. The magnitude of the financial reduction is also dependent on the number of out-of-network claims.
Financial risk is state- and MSA-dependent; 33 states have full- or partial-balance billing protections. The state laws exclude enrollees of self-funded plans, approximately 64% of the commercial population4,5. Median allowed amounts per CPT code vary significantly among MSAs. MSAs with the highest reimbursement often, but not always, have the highest percentage of out-of-network claims.
Alternative Analysis
The original methodology reflected whether an individual claim was paid as in-network or not. An alternative analysis was based on whether the provider of an individual service was a member of the payer’s network. The results were similar, with the exception that approximately 23% of claims were derived from out-of-network. The literature suggests 18% of emergency services visits resulted in at least one surprise bill, though with significant geographic variability6.
Bottom Line
The No Surprises Act will affect the specialties with the greatest out-of-network reimbursement: emergency medicine, anesthesiology, pathology/laboratory medicine and radiology7. Our analysis suggests a granular approach is necessary on a specialty and market basis to estimate the impact of the No Surprises Act. The major provider risk is a decline in prices to the median contracted rate should an Independent Dispute Resolution (IDR) process be necessary. Alternative positions are possible during the negotiation periods.
Footnotes:
1: No Surprises: Understand your rights against surprise medical bills. Centers for Medicare and Medicaid Services; January 3, 2022 https://www.cms.gov/newsroom/fact-sheets/no-surprises-understand-your-rights-against-surprise-medical-bills
2: Alltucker, Ken. 'Really astonishing': Average cost of hospital ER visit surges 176% in a decade, report says; USA Today, June 4, 2019. https://www.usatoday.com/story/news/health/2019/06/04/hospital-billing-code-changes-help-explain-176-surge-er-costs/1336321001/
3: Detailed Summary of No Surprises Act. American Hospital Association Legislative Advisory; January 14, 2021. https://www.aha.org/system/files/media/file/2021/01/detailed-summary-of-no-surprises-act-advisory-1-14-21.pdf
4: Kona, Maanasa. State Balance-Billing Protections. The Commonwealth Fund, February 5, 2021. https://www.commonwealthfund.org/publications/maps-and-interactives/2021/feb/state-balance-billing-protections
5: Yang, Jenny. Percentage of U.S. workers covered by self-funded health insurance plans from 1999 to 2021. Statista, November 11, 2021. https://www.statista.com/statistics/985324/self-funded-health-insurance-covered-workers/
6: Pollitz K, Lopes L, Kearney A, et al. US Statistics on Surprise Medical Billing. JAMA. 2020; 323(6):498. https://jamanetwork.com/journals/jama/fullarticle/2760721
7: John Hargraves and Jean Fuglesten Biniek. How common is out-of-network billing? Health Care Cost Institute; November 21, 2019. https://healthcostinstitute.org/out-of-network-billing/how-common-is-out-of-network-billing
Published
January 20, 2022
 Key Contacts
Senior Managing Director
Senior Managing Director, Leader of Healthcare Business Transformation
Senior Managing Director