Out of the Darkness
The Lasting Economic Costs of Load-Shedding
-
October 28, 2025
-

South Africa recently celebrated the official start of Spring, and the signs are all around – Namaqualand’s spectacular wildflowers have bloomed1 and South Africans are turning off their heaters. This marks a welcome change from previous years, when heaters would be turned off by the national power utility, Eskom, whenever demand for electricity outstripped supply. Load-shedding – the scheduled rotational power outages implemented to prevent a total grid collapse – left Eskom customers without power and factories idle.2
The frequency and severity of load-shedding escalated rapidly in 2022 and 2023 (Figure 1). South Africans experienced 205 days with load-shedding in 2022, with 8.1 million megawatt hours (“MWh”) shed from the grid. This worsened dramatically in 2023 to 335 days and 16.6 million MWh shed, before moderating to 83 days in 2024 and just 12 days in the first eight months of 2025, the last load-shedding occurring on 15 May.3
Figure 1 – Load-Shedding Frequency and Severity (MWh)
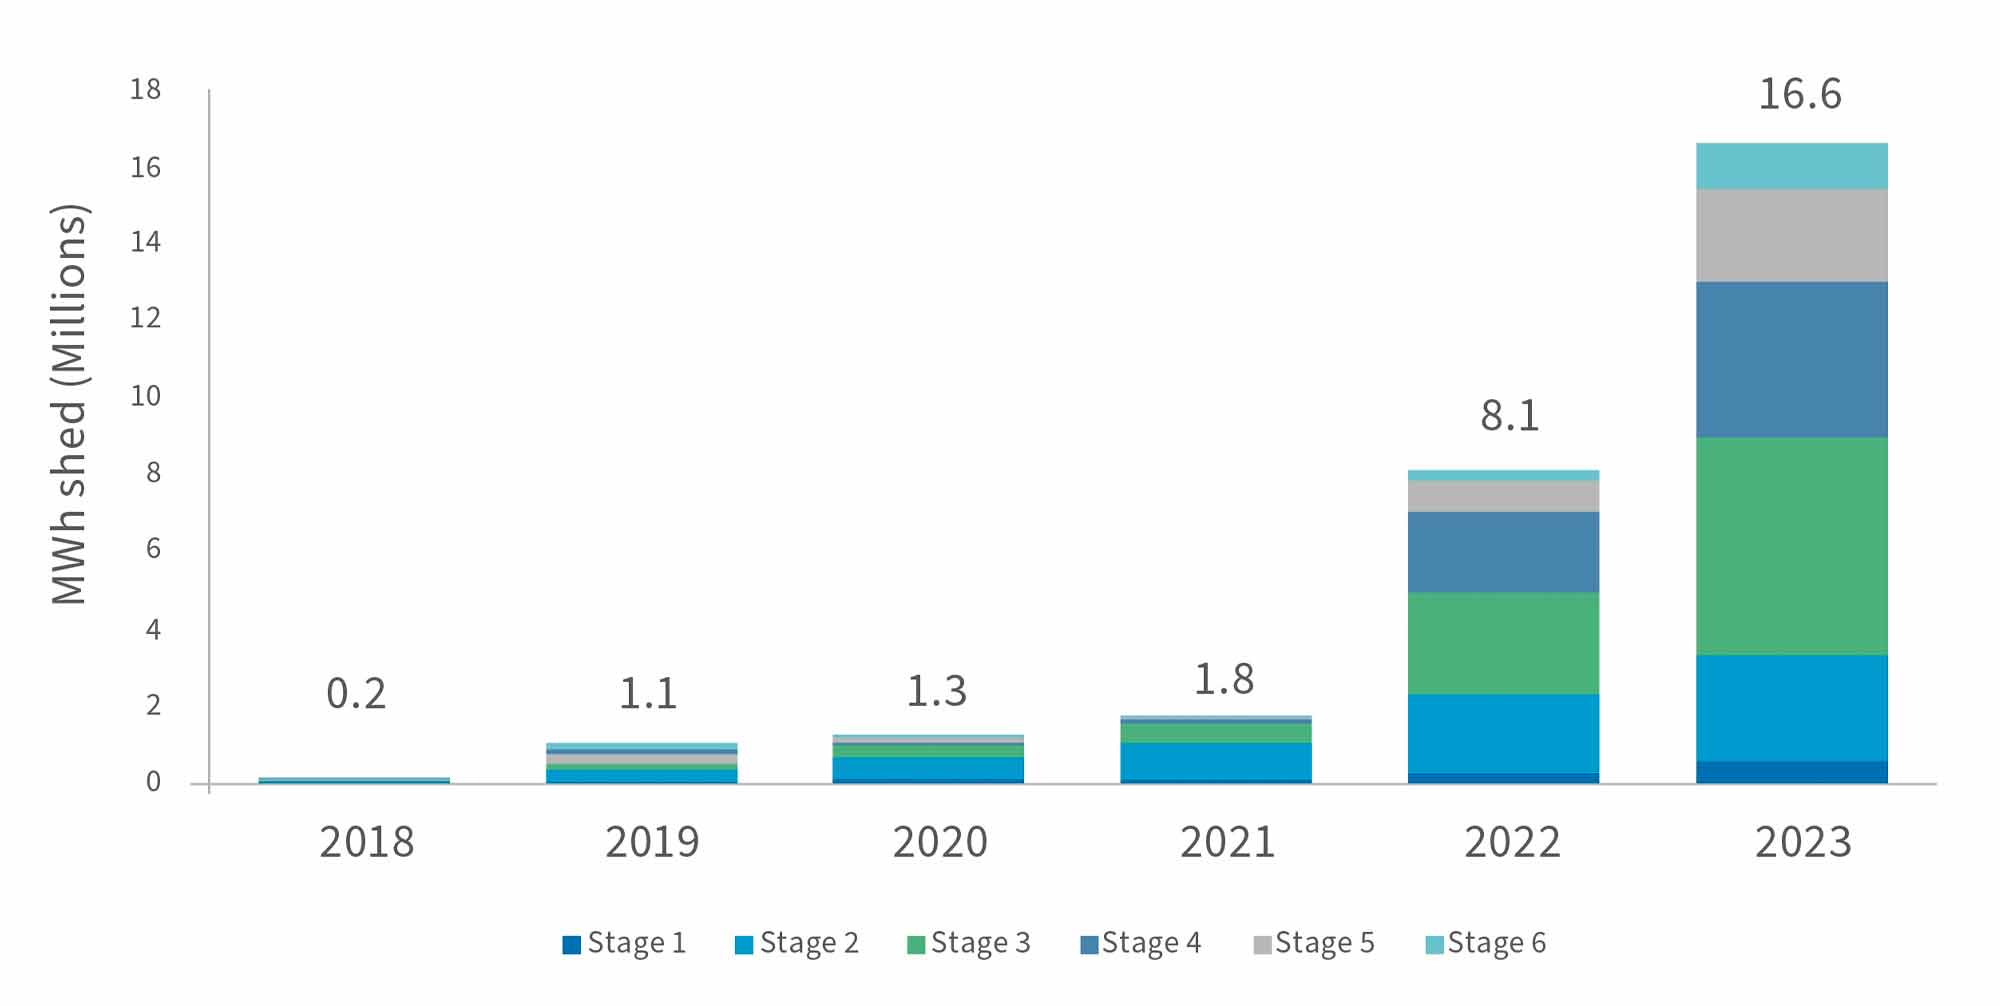
Source: National Treasury, 2024 Budget Review, Figure 2.54
South Africans made it through the winter of 2025 without experiencing major load-shedding, despite electricity demand typically peaking in July.5 However, a closer examination reveals the country remains far from reaching energy security. Eskom achieved some increase in supply through fewer unplanned outages, the return to service of Medupi Power Station’s Unit 4 and improved generative efficiency, but the improvement was limited.6
Rather than significant supply improvements, a major contributor to the lack of load-shedding was the sustained decrease in demand for Eskom-generated electricity, as industry and households switched from total reliance on Eskom to generating their own electricity. For example, National Treasury estimates that solar rooftop photovoltaic (“PV”) capacity increased by 276% to 6,165 megawatts (“MW”) between December and December 2024 (Figure 2) – more than maximum 6,000 MW that Eskom removes from the grid during Stage 6 load-shedding.7
Figure 2 – Installed Rooftop PV Capacity, December 2022 – December 2024
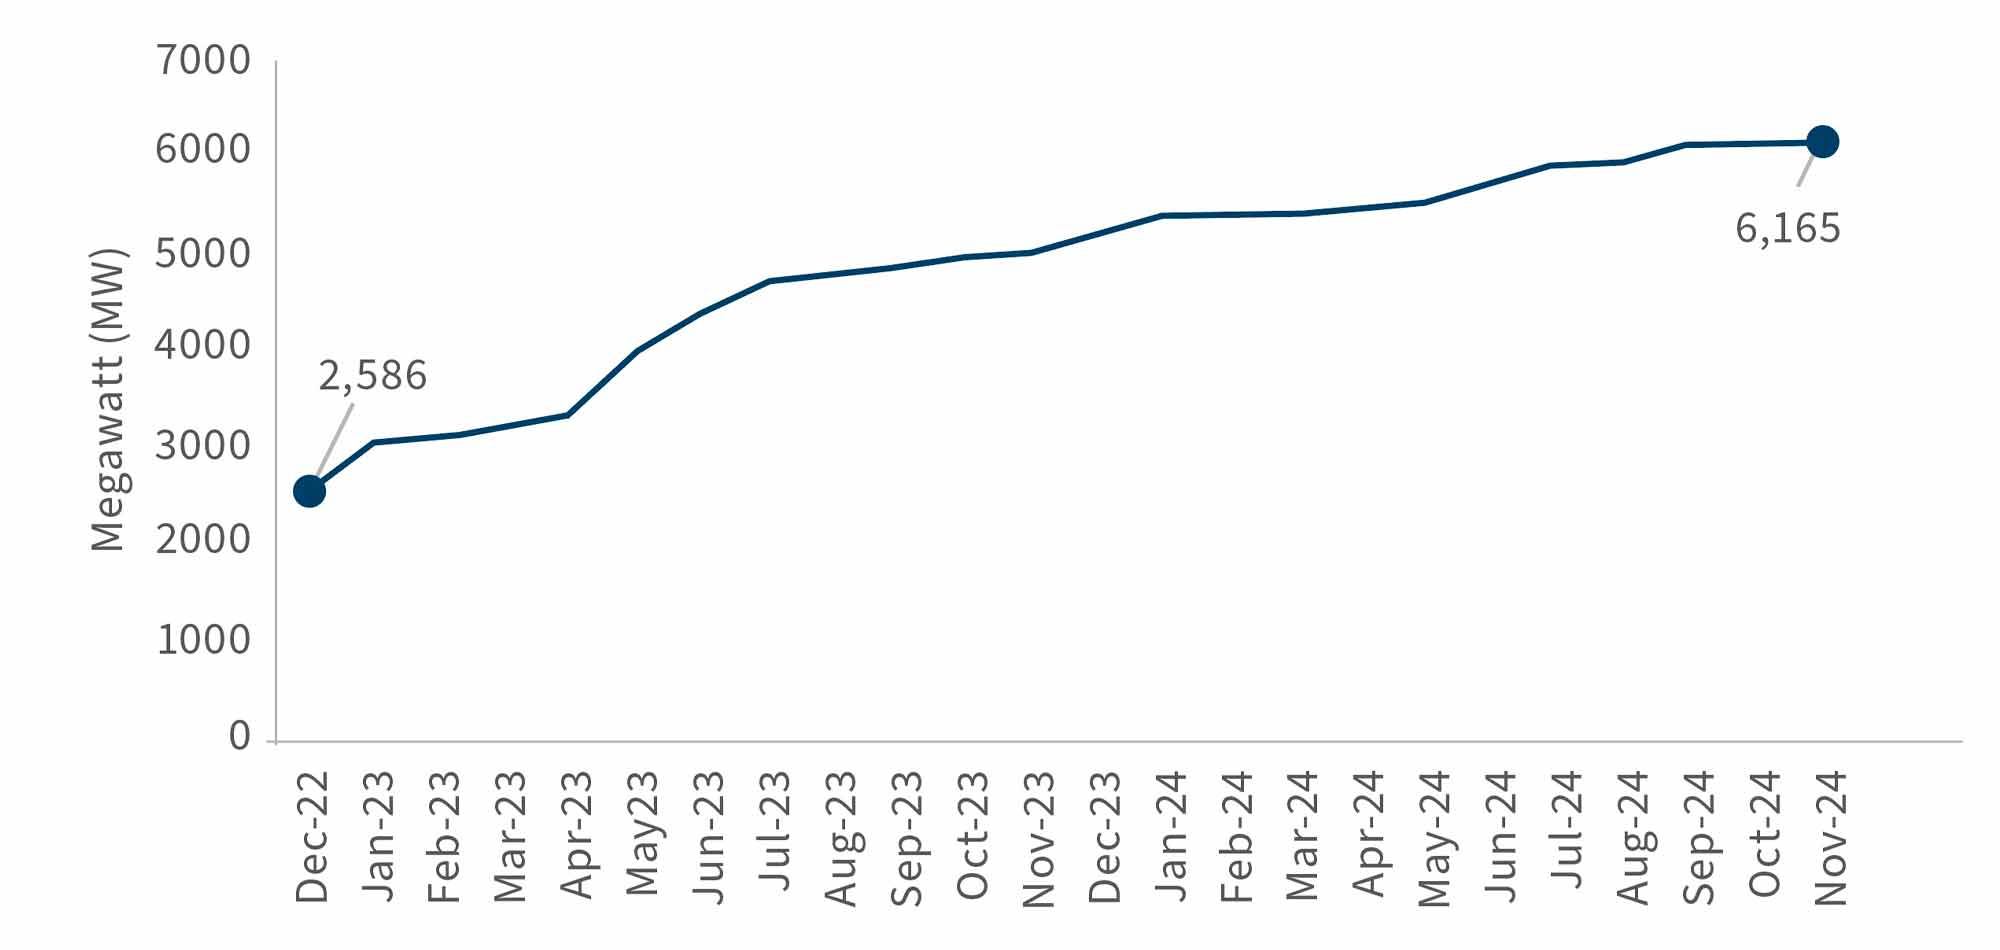
Source: Adapted from National Treasury, 12 March 2025 Budget Review, Figure 2.28
Nevertheless, significant excess demand remained,9 especially during periods without sunshine. To bridge the gap, Eskom relied on load reductions, greater electricity imports from neighbouring countries and the costly burning of diesel to run its open-cycle gas turbines.10 This approach is unsustainable and urgent investment in new generation capacity is essential to prevent a return to the crippling blackouts of 2022 and 2023 – disruptions the economy cannot afford.
The Economic Cost of Load-Shedding
South Africa’s real GDP growth rate slowed to an estimated 0.58% in 2024, following a brief post-Covid rebound (Figure 3), a stark contrast to the robust growth exceeding 5% per annum in the mid-2000s.11 Load- shedding, particularly the severe outages of 2022 and 2023, has been a key driver of this economic stagnation. By constraining the productivity of workers and firms, load-shedding fuels a vicious cycle: weaker economic activity leads to lower GDP, fewer jobs, reduced tax revenues and diminished investment and development.
Figure 3 – South Africa’s Annual Real GDP Growth Rate
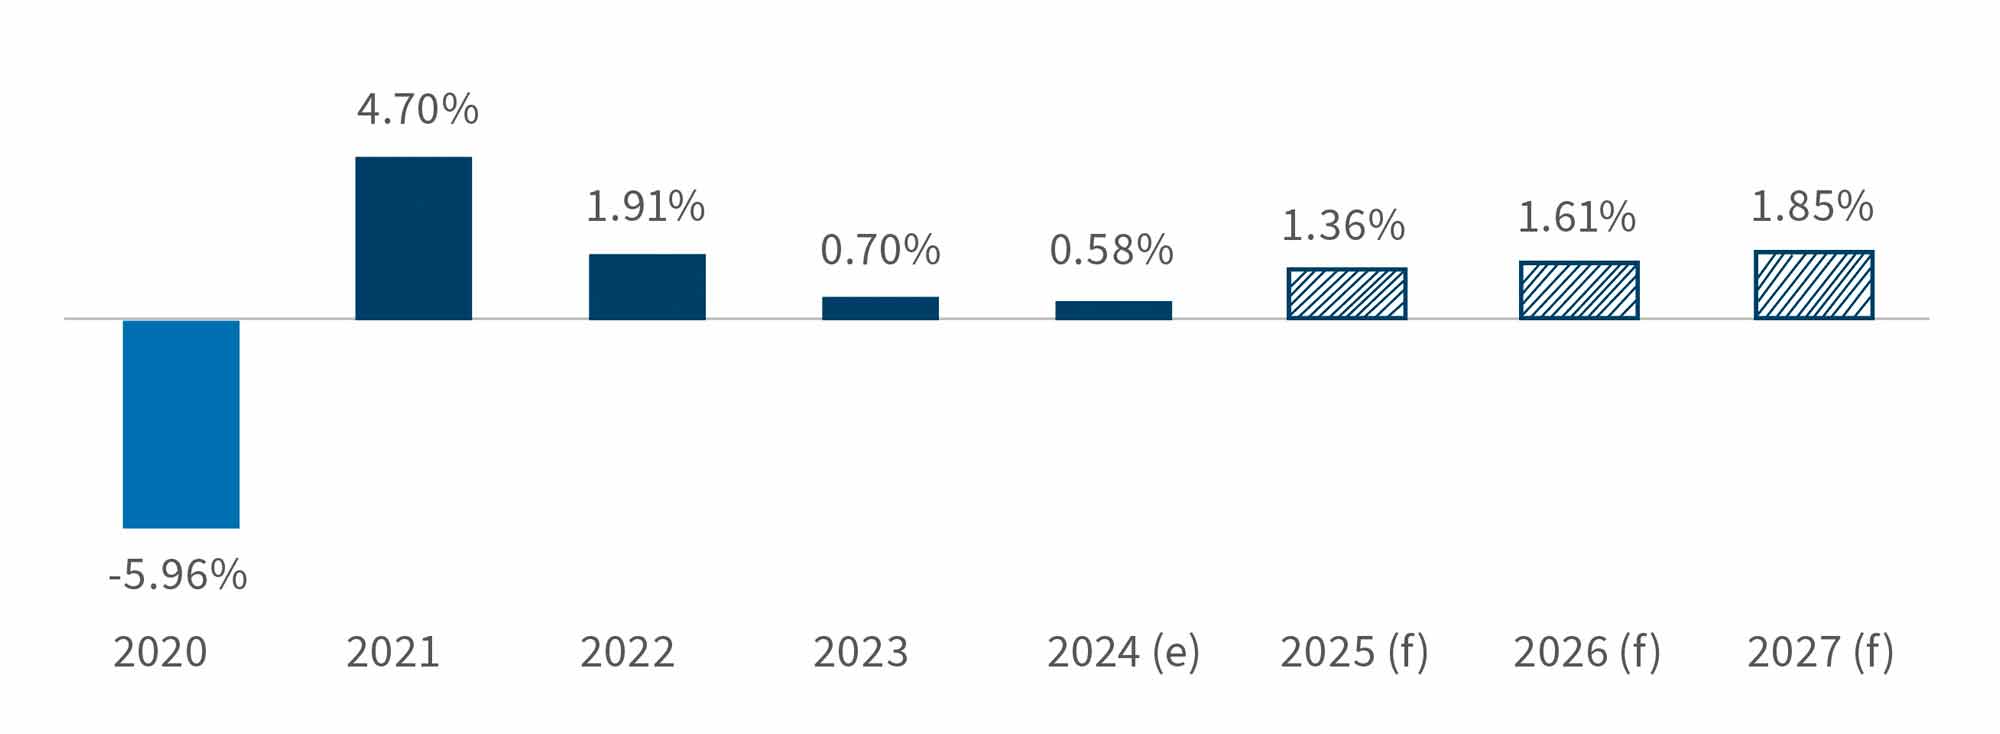
Source: National Treasury, 21 May 2025 Budget12 & 2024 Budget Review;13 (e) = estimate; (f) = forecast
Several studies have attempted to quantify the impact of load-shedding on real GDP growth. Janse van Rensburg and Morema,14 compiled estimates from a range of financial institutions for 2022. These estimates indicated that load-shedding reduced real GDP growth by between 0.2 and 4.2 percentage points, with the variation reflecting differences in methodology and underlying assumptions. The authors estimated the economic impact of load-shedding by refining earlier models and techniques to account for factors such as companies adapting to load-shedding and the less severe reduction in output if load-shedding occurred outside working hours. They found that load-shedding had lowered real GDP growth in 2022 by 0.7 to 3.2 percentage points. In other words, the various estimates show that without load-shedding real GDP growth could have been between 2.11% and 6.11% in 2022, instead of the actual 1.91%.
Despite firms adapting further to load-shedding and more severe load-shedding being scheduled outside working hours, the SARB estimated that 2023’s load-shedding reduced real GDP growth by 1.5 percentage points.15 Investment management firm Allan Gray estimated the reduction at 1.8 percentage points.16 Stated differently, had there been no load-shedding, the economy could have expanded by an estimated 2.20% to 2.50% in real terms, rather than the actual 0.70%. The Council for Scientific and Industrial Research calculated the cost of load-shedding at R116,570 for each MWh of electricity not supplied to customers, totalling R1.25 trillion for the year.17 To put this in perspective, this is almost five times the amount spent by government on healthcare in the 2022/23 financial year.18
As Figure 3 also shows, while Treasury forecasts a gradual recovery in GDP growth from 2025 onwards, the improvement is modest: 1.36% real growth in 2025, reaching a projected 1.85% in 2027. Given that load- shedding reduced real GDP growth by an estimated 0.2 to 4.2 percentage points in 2022 and 1.5 to 1.8 percentage points in 2023, the limited projected growth for 2025 to 2027 could easily be erased by a return to severe load-shedding. Preventing a relapse to the crisis levels of 2022 and 2023 is therefore an economic imperative.
The Hidden Costs of Load-Shedding
In addition to the measurable economic cost of load- shedding, there are also hidden costs for households and businesses that are more difficult to observe and quantify. These costs are felt disproportionately by SMMEs and poorer communities who are unable to afford alternative energy sources and the associated ongoing expenses.
The hidden costs of load-shedding include greater safety risks in darkness, both in terms of personal safety and stock and equipment on business premises. Businesses trading in perishable goods also face devastating losses when prolonged electricity outages spoil cold-stored inventory.
Without alternative energy sources, load-shedding also results in lost teaching time in schools, further widening the gap between learners in poorer communities and those in affluent areas that can afford back-up power. For medical facilities, a lack of power can compromise hygiene, infection control and cold storage for medicines, while electricity-dependent scans, tests and treatments may also not be available to patients.
Overall, the welfare of households, consumers and businesses suffer when load-shedding is implemented. While these effects are difficult to quantify and stem from multiple factors, they represent a critical dimension of the country’s power crisis that should not be ignored.
Conclusion
While South Africa has avoided load-shedding during the winter of 2025, real energy security remains elusive. Structural reforms and sustained investment in generation capacity, whether by Eskom or private entities, are necessary to move the country away from the current precarious position that requires costly and unsustainable measures to keep load-shedding at bay. The high cost of load-shedding in the past indicates that a repeat of this would put the expected economic growth at risk, something that South Africans and especially those in poorer communities simply cannot afford.
For businesses and investors, this underscores the importance of evaluating energy risk as a critical factor in strategic planning and asset allocation decisions. Diversifying energy sources and supporting the transition to renewable generation capacity, whether through direct investment or operational adaptation, can help mitigate exposure to future supply disruptions while contributing to a more stable economic environment.
Footnotes:
1: Rhoda, A. (27 July 2025). “Look: Wander through Namaqualand’s beautiful wildflowers” (last accessed 26 September 2025).
2: Eskom. “What is load shedding?” (last accessed 26 September 2025).
3: The Outlier. “Loadshedding” (last accessed 26 September 2025).
4: National Treasury (21 February 2024). “Budget Review 2024” (last accessed 26 September 2025).
5: Eskom (29 August 2025). “Eskom’s power system remains stable, with 105 consecutive days without loadshedding and an Energy Availability Factor (EAF) ranging between 64% and 75%.” (last accessed 26 September 2025).
6: Minerals Council South Africa (8 August 2025). “Electricity Update: June to July 2025” (last accessed 26 September 2025).
7: Eskom (2021). “Understanding the loadshedding stages” (last accessed 26 September 2025).
8: National Treasury (12 March 2025). 2025 Budget Review (last accessed 26 September 2025).
9: Nedbank Group Economic Unit (20 August 2025). “Energy Tracker: Fragile gains must give way to a more sustainable recovery” (last accessed 26 September 2025).
10: Libera, M. (12 August 2025). “The dark side of no load shedding in South Africa” (last accessed 26 September 2025).
11: International Monetary Fund DataMapper. “Real GDP growth” (last accessed 26 September 2025).
12: National Treasury (21 May 2025). “Budget Overview 2025” (last accessed 26 September 2025).
13: National Treasury (21 February 2024). “Budget Review 2024” (last accessed 26 September 2025).
14: Janse van Rensburg, T. & Morema, K. (May 2023). “Reflections on load-shedding and potential GDP”. South African Reserve Bank Occasional Bulletin of Economic Notes OBEN/23/01 (last accessed 26 September 2025)(p. 44-58).
15: South African Reserve Bank (April 2024). “Monetary Policy Review April 2024”. (last accessed 26 September 2025).
16: Adams, R. (1 February 2024). “Eskom: Are brighter days ahead?” (last accessed 26 September 2025).
17: Council for Scientific and Industrial Research Energy Research Centre (17 March 2025). “Utility-scale power generation statistics in South Africa 2024” (last accessed 26 September 2025)(p. 73).
18: National Treasury (22 February 2023). “2023 Budget Review, Chapter 5” (last accessed 26 September 2025)(Table 5.4).
Related Insights
Published
October 28, 2025