Value-Based Compensation: Still Lagging
-
December 22, 2021
Downloads Download Article
-

The advent of value-based care, based on the Institute for Healthcare Improvement “Triple AIM” framework—improving the health of populations, reducing the per capita cost of care and improving the individual experience of care—has pressured providers to shift their focus from volume to value1. And, as providers shift to value-based activities, their reimbursement model is also more in alignment with payers. Like payers, providers now benefit from a fundamental understanding of and ability to manage risk.
Managing the total cost of care is essential. This includes investment in information technology, analytics and select personnel, e.g., care coordinators. The chronic-disease life cycle is typically progressive, subject to acute, intermittent events and best managed by primary care physicians.
In this article, we focus on the complexity of the emerging value-based ecosystem and its implications for physician compensation. The transition from relative value units (“RVUs”) to more value-oriented metrics is lagging.
Medicare: Focused on Quality and Total Cost of Care
Value-based initiatives are being driven by Medicare. The Centers for Medicare & Medicaid Services estimated that, in 2020, 61.7 million Medicare beneficiaries would incur total expenditures of $858.5 billion, or $13,909 per enrollee2. Due to a rapidly aging population, Medicare expenditures are forecast to reach $1,5594. billion in 2028, with spending per enrollee reaching $20,7513. Medicare’s focus on value-based reimbursement will gain urgency as the population ages and costs rise.
Evolution of Healthcare Delivery
| Current Provider Model | Emerging Provider Model |
|---|---|
| Volume-driven | Value-driven |
| Patient-based | Population-based |
| Acute, espisodic intervention | Proactive, longitudinal intervention (prevention) |
| Disease/condition-centric | Patient-centric (co-morbidities, social determinants) |
| Facility-centric | Home-centric |
| Care fragmentation/segmentation | Care coordination (case management) across the continuum |
| Subjective: experience-based | Objective: data-driven |
| Process quality measures | Outcome quality measures |
| Procedure and/or facility costs | Total cost of care |
| Transactional | Relationship-based |
| Performance: Margin per service or procedure | Performance: Margin per covered or attributed life |
A common structure used to manage value-based initiatives is an accountable care organization (“ACO”), which is composed of “groups of doctors, hospitals, and other health care providers and suppliers who come together voluntarily to provide coordinated, high-quality care at lower costs to their Original Medicare patients.”4 Most ACOs have multiple participating providers comprising hospitals, health systems, physician groups and solo practitioners.
In 2021, approximately 11.9 million Medicare beneficiaries were enrolled in 518 ACOs; 10.7 million (90 percent) in Medicare Shared Savings Program (“MSSP”) and 1.2 million (10 percent) in Next Generation ACOs5,6. The MSSP requires ACOs to meet quality and performance benchmarks, and then offers shared savings when the ACOs achieve their goals. The majority of MSSP participants, 59 percent, were enrolled with one-sided, upside-only risk, and the remaining 41 percent were enrolled with two-sided, upside/downside risk7. Next Generation ACOs allow participants to assume higher levels of risk and, potentially, higher rewards. The program is ending after this year8. The average size of an ACO is 22,973 members.
In 2020, 67% of ACOs (n=513) had shared savings of $2.28 billion, or $6.6 million per participating ACO9.
The Medicare Access and CHIP Reauthorization Act of 2015 (“MACRA”) requires CMS to implement an incentive program, the Quality Payment Program, with two tracks: Merit-Based Incentive Payment System (“MIPS”) and the Advanced Alternative Payment Model (“AAPM”)10. MIPS combines the Electronic Health Record Incentive Program (Meaningful Use), the Physician uality Reporting System (“PQRS”) and the Value-Based Payment Modifier (“VBPM”), and applies to most physicians11. AAPM applies to ACOs, episodes of care and medical home, and will increase focus on a composite score of quality, cost, the use of information and clinical practice improvement. MIPS bonus and penalty opportunities will range from +/-4% of Medicare reimbursement in 2019 to +/-9% in 202212.
Medicare Advantage (“MA”): Managing Risk
In 2021, 26.4 million people, 42% of the Medicare population, were enrolled in Medicare Advantage plans13. The Congressional Budget Office projects a 46% share in 2025 and 51% by 203014. MA plans receive a fixed revenue per member per month (“PMPM”) based on the demographics of the plan’s member population, overall level of health (e.g., risk-adjusted factor score) and quality bonuses (e.g., STARS). Offsetting the revenues are health-related costs (i.e., Medical Loss Ratio) and SG&A.
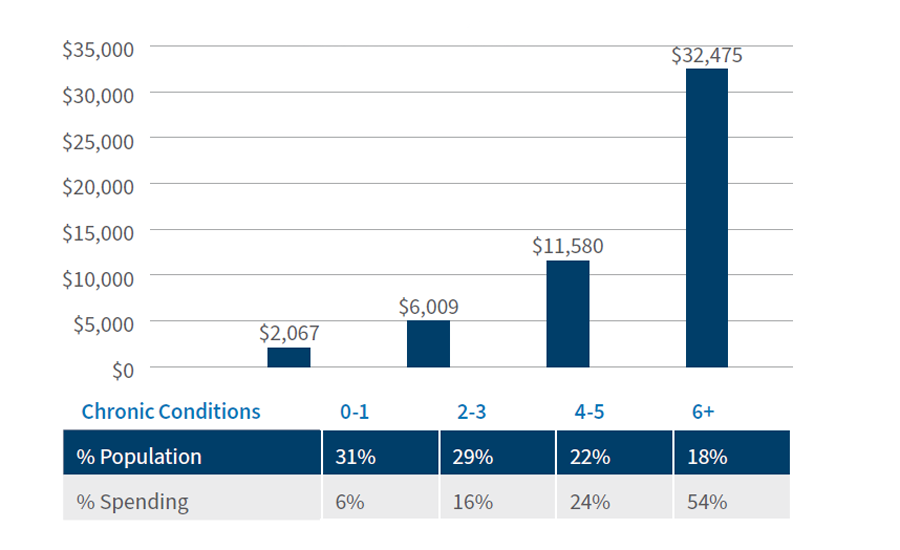
Population health is “the health outcomes of a group of individuals, including the distribution of such outcomes within the group15.” Healthcare costs are concentrated, with 18% of the Medicare population accounting for 54% of costs. Conversely, 31% of beneficiaries account for 6% of costs16. The number (and severity) of chronic conditions is a predictor of costs, which are somewhat persistent from year to year17. The key to effective chronic care management is risk stratification, proactive intervention and transition management. The total cost of care is driven by hospital admissions, re-admission and emergency department visits.
The Risk Adjustment Factor (“RAF”) score, based on demographic factors (age, sex), and Hierarchical Condition Categories (“HCC”), “sets of medical codes that are linked to specific clinical diagnoses,” are used by the Centers for Medicare & Medicaid Services (“CMS”) to project the expected risk and future annual cost of a patient18.
Aging Population Associate with Rising Chronic Disease Burden
Aging Baby Boomers, 2010-2030
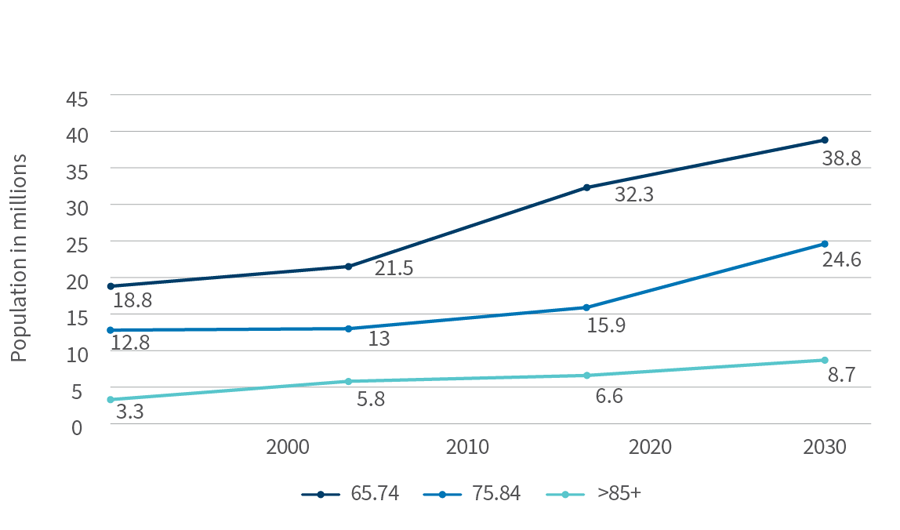
U.S. Census Bureau; Medicare Chronic Condition Warehouse https://www2.ccwdata.org/documents/10280/19099065/b2-prevalence-current-year.jpg
Per Capita Spending in Medicare FFS Beneficiaries, 2018
They are used by CMS to calculate PMPM payments to managed care plans and accountable care organizations. The PMPM payment is set irrespective of actual utilized services. HCC documentation is essential to obtain full reimbursement.
“Recapture Rate is the rate at which providers capture (code) recurring HCC diagnoses on an annual basis. A standard goal is 85% recapture rate19.”
“The Healthcare Effectiveness Data and Information Set (“HEDIS”) is a [standardized] tool used by more than 90 percent of U.S. health plans to measure [comparative] performance on important dimensions of care and service20.” HEDIS reporting is a requirement of health plans by the National Committee for Quality Assurance and CMS for use in health plan accreditation, star ratings and regulatory compliance21,22.
Data can be used to identify opportunities for improvement (“gaps in care”), monitor quality improvement initiatives and track improvement. HEDIS has five domains (>70 measures): effectiveness of care, access/availability of care, experience of care, utilization and risk-adjusted utilization, and measures reported using electronic clinical data systems23. It measures for two types of care: preventive care and condition-specific care. HEDIS rates can be calculated via claims and/or electronic medical record data.
Primary Care Physicians Are Beleaguered
Primary care physicians will be at the vanguard of value-based care, as they are responsible for chronic disease management and managing transitions of care.
Approximately 27% of physicians involved in patient care are family practitioners, geriatricians or internal medicine specialists; 46.5% are 55 years old or older24. A shortage of 14,900 primary care physicians already exists, and the shortage is projected to reach 21,000-38,000 by 202525. Primary care physicians earn $243,000 annually, 30% less than specialists26. The proportion of physician demand for primary care by the population 65 years of age and older is projected to increase from 33% in 2018 to 42% in 203327. Unlike in the past when they had thriving private practices, many primary care physicians are employees of hospitals, health systems or other corporate entities.
Value-Based Compensation Trends
In the fee-for-service payment model, doctors are compensated based on volume of care—how many patients they can see, how many tests they order, how many prescriptions they write. Value-based payment models are based on well care for patients: better everyday health and fewer hospital visits. In an effort to drive towards value-based care, alternative payment models (“APMs”) and other value-based reimbursement mechanisms have been gaining traction in recent years.
As of 2018, Medicare accounted for 25% of personal healthcare expenditures28. “APMs made up approximately 36% of Medicare payments compared to just 25% in 201529.” In total, APMs accounted for only 9% of personal healthcare expenditures. Additionally, nearly 60% of Medicare beneficiaries were enrolled in Medicare managed care plans or assigned to an accountable care organization in 202030,31.
Recent changes to federal law have lowered barriers to value-based care. CMS and the Office of Inspector General created new flexibility under the Stark law and anti-kickback statute for value-based arrangements to allow providers to enter value-based care arrangements that previously may have been prohibited32.
Median compensation across the primary care specialties of family medicine, internal medicine and pediatrics, based on the AMGA Medical Group Compensation and Productivity Survey, rose 4.5% in 2019 while median productivity rose 0.44%33. Comparable figures for 2020 were 0.4% and -10.6%34. The relationship between compensation and productivity is not linear. With the recent CMS Fee Schedule, the upward trend in compensation for primary care physicians has resumed.
Carefully crafted value-based compensation models provide new opportunities to align providers and to incentivize activities that promote value-based goals. If created appropriately, the new models can maintain historic levels of compensation, or even drive greater than historic levels, for primary care physicians.
Suggested Next Steps
An effective physician compensation plan is not a static plan; it is a complex entity with a physician-administrator partnership at its foundation with assigned responsibilities for and functions to plan, model, communicate, implement and examine:
- Plan – Ensure that physicians have a voice in plan design. The design should be around governmental and commercial value-based care arrangements. Understanding the reimbursement disparities in FFS and value-based arrangements for your organization is crucial.
- Model – Link physician compensation model to organizational goals and strategy. Models should balance productivity and quality-based measures and should include plan incentives that drive quality outcomes.
- Communicate – Ensure transparency. Organizations should transparently disseminate their compensation methodology to the physician community and enlist peer champions with a deep understanding of the methodology to help their colleagues understand the new model.
- Implement – Be intentional with the pace of change. Ensure appropriate time is allotted for collaborations on new information systems, reports on care delivery, care management, care transitions and the development of care models that drive quality outcomes.
- Examine – Share data and tools to help physicians improve performance. Consistently monitor the plan and modify as necessary. Retrospective reports on patient-level analytics could help physicians measure, track and improve their performance.
Footnotes:
1: IHI Triple Aim Initiative, Institute for Healthcare Improvement https://www.ihi.org/Engage/Initiatives/TripleAim/Pages/default.aspx
2: Centers for Medicare & Medicaid Services—National Health Expenditures, Projected; Table 17 https://www.cms.gov/Research-Statistics-Data-and-Systems/Statistics-Trends-and-Reports/NationalHealthExpendData/NationalHealthAccountsProjected
3: Ibid.
4: Centers for Medicare & Medicaid Services—Next Generation ACO Model https://innovation.cms.gov/innovation-models/next-generation-aco-model
5: Centers for Medicare & Medicaid Services—Shared Savings Program Fast Facts—As of January 1, 2021. https://www.cms.gov/files/document/2021-shared-savings-program-fast-facts.pdf
6: Susan Morse. Updated with list: Majority of Next Generation ACOs earned shared savings. Healthcare Finance; January 15, 2021 https://www.healthcarefinancenews.com/news/majority-next-generation-acos-earned-shared-savings
7: Centers for Medicare & Medicaid Services—Shared Savings Program Fast Facts—As of January 1, 2021. https://www.cms.gov/files/document/2021-shared-savings-program-fast-facts.pdf
8: Robert King. Biden admin to end Next Gen ACO model after this year. Fierce Healthcare; May 21, 2021
9: Performance Year Financial and Quality Results. CMS Provider Characteristics & Initiatives/Medicare Shared Savings Program (last updated August 25, 2021). https://data.cms.gov/medicare-shared-savings-program/performance-year-financial-and-quality-results
10: Quality Payment Program. CMS.gov https://www.cms.gov/Medicare/Quality-Payment-Program/Quality-Payment-Program
11: An Introduction to Value-Based Care for Independent Primary Care Practices. Aledade; February 5, 2021, p. 6. https://resources.aledade.com/guides/a-comprehensive-guide-to-value-based-care-for-primary-care
12: MIPS Scoring and Payment Adjustments. American College of Surgeons. https://www.facs.org/advocacy/qpp/2021
13: Meredith Freed, Jeannie Fuglesten Biniek, Anthony Damico, and Tricia Neuman. Medicare Advantage in 2021: Enrollment Update and Key Trends. KFF; June 21, 2021 https://www.kff.org/medicare/issue-brief/medicare-advantage-in-2021-enrollment-update-and-key-trends/
14: Ibid.
15: David Kindig and Greg Stoddart. What Is Population Health? American Journal of Public Health 93, no. 3 (March 1, 2003): pp. 380-383 https://ajph.aphapublications.org/doi/full/10.2105/AJPH.93.3.380
16: Chronic Conditions among Medicare Beneficiaries. Chronic Conditions Charts: 2018 https://www.cms.gov/Research-Statistics-Data-and-Systems/Statistics-Trends-and-Reports/Chronic-Conditions/Chartbook_Charts
17: Steven B. Cohen. The Concentration and Persistence in the Level of Health Expenditures over Time: Estimates for the U.S. Population, 2012-2013. Agency for Healthcare Research and Quality, September 2015 https://meps.ahrq.gov/data_files/publications/st481/stat481.pdf
18: Lauren Stockl. HCC 101: What you need to know about Hierarchical Condition Categories. Intelligent Medical Objects; August 28, 2020 https://www.imohealth.com/ideas/article/hcc-101-what-you-need-to-know-about-hierarchical-condition-categories/
19: Kris Gates. What is HCC Recapture Rate? August 27, 2019 https://www.linkedin.com/pulse/what-hcc-recapture-rate-kris-gates-j-d-/
20: U.S. Department of Health and Human Services. Healthcare Effectiveness Data and Information Set (“HEDIS”). Healthy People 2030. https://health.gov/healthypeople/objectives-and-data/data-sources-and-methods/data-sources/healthcare-effectiveness-data-and-information-set-hedis
21: NCQA Health Plan Accreditation. https://www.ncqa.org/programs/health-plans/health-plan-accreditation-hpa/
22: Medicare Advantage Star Ratings Enhancement: The Cost of Complacency for Health Plans. Adhere Health; January 14, 2021 https://adherehealth.com/medicare-advantage-star-ratings-enhancement-the-cost-of-complacency-for-health-plans/
23: NCQA Health Plan Accreditation. https://www.ncqa.org/programs/health-plans/health-plan-accreditation-hpa/
24: Association of American Medical Colleges. Active Physicians in the Largest Specialties, 2019; 2020 Physician Specialty Data Report. https://www.aamc.org/data-reports/workforce/interactive-data/active-physicians-largest-specialties-2019
25: The Complexities of Physician Supply and Demand: Projections From 2018 to 2033, Exhibit4. AAMC; June 2020, p. 32. https://www.aamc.org/system/files/2020-06/stratcomm-aamc-physician-workforce-projections-june-2020.pdf
26: Medcape Physician Compensation Report 2020. https://www.medscape.com/slideshow/2020-compensation-overview-6012684#4
27: The Complexities of Physician Supply and Demand: Projections From 2018 to 2033. AAMC; June 2020, p. 32. https://www.aamc.org/system/files/2020-06/stratcomm-aamc-physician-workforce-projections-june-2020.pdf
28: CMS.gov National Health Expenditures, Projected. Table 5: Personal Health Expenditures by Source of Funds. https://www.cms.gov/Research-Statistics-Data-and-Systems/Statistics-Trends-and-Reports/NationalHealthExpendData/NationalHealthAccountsProjected
29: Understanding Value-based Compensation Models. Coker Group; September 7, 2021 https://cokergroup.com/understanding-value-based-compensation-models/
30: Meredith Freed, Anthony Damico, and Tricia Neuman. A Dozen Facts About Medicare Advantage in 2020. KFF; January 13, 2021 https://www.kff.org/medicare/issue-brief/a-dozen-facts-about-medicare-advantage-in-2020/
31: Centers for Medicare & Medicaid Services—Shared Savings Program Fast Facts—As of January 1, 2021. https://www.cms.gov/files/document/2021-shared-savings-program-fast-facts.pdf
32: Lori Oliver, Neal Shah, Jeanna Gunville, Stephen Angelette, Kathleen Sutton. A New Framework: CMS and OIG Modernize the Stark Law and Anti-Kickback Statute. Polsinelli; December 2020. https://sftp.polsinelli.com/publications/healthcare/resources/A_New_Framework-CMS_and_OIG_Modernize_the_Stark_Law_and_Anti-Kickback_Statute.pdf
33: Christopher Cheney. Physician Compensation Increased 0.12% In 2020, AMGA Survey Report Says. healthleaders: August 20, 2021 https://www.healthleadersmedia.com/clinical-care/physician-compensation-increased-012-2020-amga-survey-report-says
34: Ibid.
Related Insights
Related Information
Published
December 22, 2021
 Key Contacts
Managing Director