Realizing the Return: Ensuring Service Providers Deliver on Their Value Promise
-
February 28, 2022
Downloads Download White Paper
-

In this paper, we highlight the importance of ensuring that vendors and service providers deliver the value they promise and their clients expect. We also provide an overview of the return-on-investment (ROI) methodology developed by FTI Consulting in partnership with DataLink, a population health management company, to quantify the value being delivered to one of DataLink’s largest customers. FTI Consulting’s methodology and assumptions are outlined, as are data to support our empirically tested finding that DataLink provides its clients with a financial benefit of approximately 5:1.
Medicare’s focus on value-based reimbursement has gained urgency as the program’s costs rise. In 2020, there were 61.7 million Medicare beneficiaries, and total expenditures were $858.5 billion; spending per enrollee was $13,9091. Due to rapid growth of the 65-and-older portion of the population, Medicare expenditures are forecast to reach $1,5594. billion in 2028, with spending per enrollee reaching $20,7512.
Approximately 42% of Medicare beneficiaries are enrolled in Medicare Advantage plans; this segment is projected to reach 46% by 20253. Significant tailwinds are propelling this growth, including an aging population; the continued increase in overall Medicare costs; government support and benefit flexibility (e.g., transportation, food assistance, social support); and innovation-driven initiatives from the Centers for Medicare & Medicaid Services (CMS).
Payers have noticed and responded. Over the past few years, thousands of new companies have entered the Medicare Advantage market. All this activity has made a highly competitive market even more so: the number of plans available per eligible member increased from 19 in 2016 to 33 in 2021.4 The actual number of plans increased from 2,001 to 3,550 during this period.5 Despite a large number of offerings, four firms — United Healthcare, Humana, BCBS and Aetna — account for 70% of enrollment6.
Providers also are attracted to the Medicare Advantage marketplace. Whether through creating a provider-sponsored plan or by partnering with a major payer in a risk-bearing capitation arrangement, an increasing number of provider groups and similar fast-growing companies are taking on responsibility for being both provider and payer.
Countless healthcare technology and services vendors have followed payers and providers into the value-based care market, promising to lower costs, improve operating performance and/or increase financial returns. In most cases, the opportunities provided by the technologies and services of these firms are clear; however, data may not exist to quantify the returns realized from investment in a vendor’s product or service.
Given the tight margins in healthcare, it is important that health plans have a structured framework with which to manage their vendors and other service providers. Part of this framework should be ensuring that the vendor or service provider supplies the plan with regular updates on ROI. The challenge of providing this data for many vendors is knowing how to develop an accurate ROI model that clients will trust.
Managing Risk Is Challenging for Medicare Advantage Plans
For all the interest and investment in the Medicare Advantage market, what may be surprising is the limited success most new entrants have had. Of the thousands of new market entrants, only about 100 have attracted and sustained membership of over 10,000 members 7.
When competing in a market where national payers have millions of members, it takes high levels of customer satisfaction to grow and maintain membership, and requires skilled management to establish a profitable Medicare Advantage plan. This is because the business model for Medicare Advantage plans has a limited number of variables that management can control.
Revenue for Medicare Advantage plans is generated from monthly premiums paid by CMS, and is intended to support healthcare delivery to plan members. Three main components drive this revenue stream:
- Demographics of the plan’s member population — Age, gender and geography all play a role in determining the demographic component of Medicare Advantage premiums, but this normally accounts for approximately 50% of plan revenue.
- Overall level of membership health — In Medicare Advantage populations, significant levels of disease impact the level and cost of care, with sicker populations costing more to treat. CMS accounts for this through a mechanism called Risk Adjustment and compensates plans for the level of disease within their membership base. Condition-based Risk Adjustment premiums can account for up to 45% of plan revenue.
- STARS and other quality bonuses — CMS developed the Medicare STARS program, which gives rewards for how well plans and providers perform on measures of member satisfaction (assessing both plan and providers), health outcomes and plan operations. This can account for 5%-10% of plan revenue.
Health plan expenses generally fall into two categories, healthcare delivery expenditures, and other administrative costs associated with running the business.
- Healthcare delivery expenses are commonly measured in terms of utilization rate and medical loss ratio (MLR). The MLR is calculated by dividing all healthcare-related expenses by the plan premiums or revenue. Most healthcare delivery-related expenses are submitted via claims, and the remainder include costs for providing services such as wellness, population health and other quality-related programs. Medical losses are challenging to predict and, generally, there are only minor impacts that plan management can take to affect medical usage. Given that MLR rates typically average between 85% and 90% of revenue, any impact management can have on MLR rates is welcome.
- The other main category of expenses is selling, general and administrative (SG&A) costs – the expenses associated with marketing and operating the non-healthcare operations that a plan requires to do business. These typically include sales and marketing, regulatory, finance, HR, technology and all other operations.
Industry profitability data further illustrate the difficulty of managing a health plan. As noted in Oliver Wyman’s Health Insurer Financial Insights newsletter, the average pre-tax profit margin for all health plans in 2019 was 3.5% (more recent annual figures are skewed by COVID-related impacts)8.
Developing a Framework to Measure ROI
Given the low margins in healthcare, management teams regularly try to influence the levers controlling revenues and expenses by closing quality gaps and accurately addressing member chronic conditions; reducing the use of medical care by lowering hospital admissions, readmissions and emergency department visits; tightening oversight of SG&A expenses; and ensuring that any investments in vendors are effective and provide a positive return on investment for the organization.
The highest-performing health plans have a structured framework for managing vendors and other service providers. Part of this framework is focused on ensuring that the vendor or service provider actually provides the plan with regular updates on ROI. The challenge of providing this data for many payers and vendors alike is knowing how to develop an accurate and reliable ROI model. Analytical software provider DataLink recently engaged with FTI Consulting to demonstrate that by analyzing data on the use of its platform by a national health plan customer’s provider network, it could measure the actual financial value realized from the plan’s investment in the tool and from its widespread adoption.
Using powerful analytics, DataLink’s platform facilitates end-to-end population health management for payers, ACOs, provider groups and health systems that aspire to provide superior, high-quality care to their patients and members. DataLink’s infrastructure supports the secure exchange of patient data as the client migrates from disparate sources to DataLink’s secure solution, and their analytics and reporting capabilities normalize claims, lab and pharmacy data from provider and payer systems to provide views into critical patient care needs.Patient data is presented to providers during patient visits to remind the provider about the patient’s chronic conditions that may require care. The inherent goals are for the provider to assess and treat a patient’s existing conditions, and accurately document the status and care of each condition with a goal of ensuring more complete patient visits that increase care quality, lead to better patient outcomes and reduce long-term healthcare costs.
DataLink’s customer rolled out access to the platform to hundreds of provider groups in 2018 and 2019, as part of an initiative to promote data-sharing between the payor and its provider network, assist providers with clinical decision-making, and improve patient care and outcomes. Over the first two years of the contract, adoption and use of the platform varied across the customer’s provider network. As part of its contract review process, the customer asked DataLink to study and calculate the degree to which platform use was driving favorable risk, quality and utilization outcomes.
To calculate the customer’s ROI, DataLink and FTI Consulting designed a difference-in-differences (DiD) estimation framework (1) to measure performance changes in the treatment group versus a control group at two points in time, and (2) to understand the effect provider use of the platform had on key outcome metrics, including the financial return resulting from improved performance in those areas.
Below is an overview of DataLink’s and FTI Consulting’s ROI calculation:
I. Study Platform Usage: Analyze provider-specific platform interaction frequency and volume, and set meaningful use thresholds/levels (e.g., reports viewed in over 90% of eligible weeks).
II. Determine Platform Impact: Understand where the platform creates value and identify measurement methodologies (e.g., HCC Recapture rate performance).
III. Set a Baseline: Evaluate performance in key measurement areas prior to platform adoption.
IV. Measure Change in Performance: Track performance change subsequent to platform adoption.
V. Compare Across Usage Levels: Identify differences in performance between users and non-users of platform, and across usage levels (i.e., “difference in differences” causal inference).
VI. Assess Robustness and Identify Confounding Factors: Assess differences in provider mix across usage levels and control for differences through application of additional statistical frameworks, as needed.
VII. Calculate Platform ROI: Estimate financial impact associated with platform user performance (e.g., value incremental Hierchical Condition Categories (HCC) recapture).
VIII. Estimate Full Opportunity: Extrapolate financial impact to additional providers using adoption growth scenarios.
ROI Analysis and Results
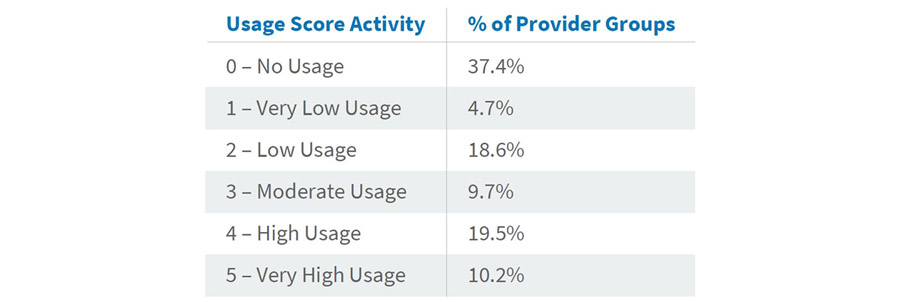
I. Study platform usage
Transactional data was extracted from the DataLink platform and analyzed for platform users at the payer organization and across its network of contracted provider groups. Distributions of platform interaction (e.g., patient searches and risk/quality report views) were created to identify common levels of interaction frequency across groups and to set “Usage Score” thresholds by which to compare group performance across levels of interaction with the platform. Downward adjustments to initial Usage Score assignments were made using a calculated ratio of interactions per attributed members to normalize Usage Scores across groups with varying membership. The table below reflects the distribution of groups across the final Usage Score measure.
II. Determine platform impact
Consistent use of the DataLink platform is expected to drive performance in key areas, one of which is the complete and accurate identification, treatment and documentation of patients’ chronic conditions and care gaps. The DataLink platform identifies and presents key clinical information to providers at the point of care, such as previously diagnosed chronic conditions and Healthcare Effectiveness Data and Information Set (HEDIS) care gaps. The goal is to support a more complete patient visit and increase the quality of patient care, leading to better patient outcomes and reduced long-term healthcare costs. Improvements to a provider’s complete and accurate assessment, treatment and documentation of a patient’s chronic conditions, and related reductions in the frequency of missed diagnosis, in turn, enhance the accuracy of the risk adjustment-based reimbursement that plans receive based on the acuity-level of their member population. These improvements and their related impacts to patient care can be measured through changes to the chronic-condition component of patient risk scores.
Using a claim feed from the payor, a calculation was performed to estimate the cumulative, year-end risk adjustment factor value associated with each member’s chronic conditions using diagnostic codes provided by the customer’s network of providers. This metric, termed the “Chronic RAF Score,” did not include factors outside of what the platform is expected to impact (e.g., patient demographic or acute condition risk adjustment factor value) and was used to identify year-over-year changes in group performance.
III. Set a baseline
Each group’s baseline performance was calculated as the average attributed patient Chronic RAF Score at year-end of the calendar year preceding its first interaction with the DataLink platform. For example, if a provider first logged in and ran a report on the platform in March 2019, the provider’s year-end 2018 Chronic RAF Score was used as the provider’s baseline.
IV. Measure change in performance
The same Chronic RAF Score metric was then calculated as of year-end 2020 for each provider group. Change in performance was measured as the difference in a provider’s Chronic RAF Score between the two time periods.
V. Compare across usage levels
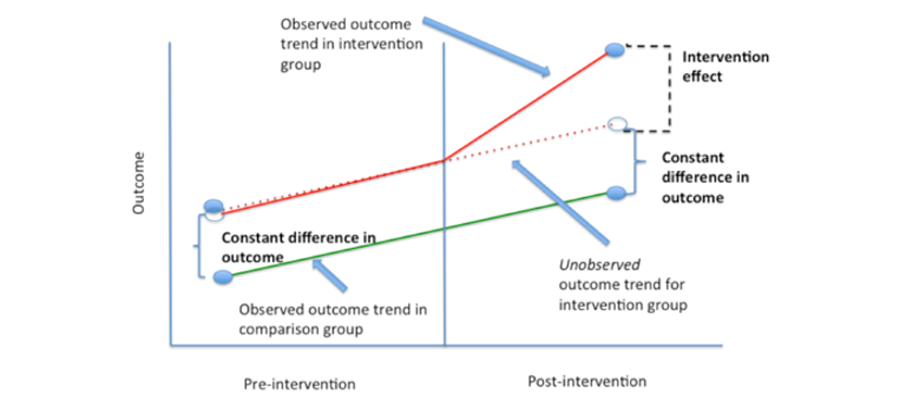
To estimate the impact of the DataLink platform on the Chronic RAF Score metric, a difference-in-differences estimation was performed. A DiD estimation assumes that the change in performance of providers not on the DataLink platform is a proxy for the change in performance that would have been observed for providers on the DataLink platform in the absence of platform use. In our case, the performance (i.e., the Chronic RAF Gap delta between the base year and 2020) of the user population was compared to that of the non-user population. The image below is a classic illustration of the difference-in-differences estimation framework, where the relative impact of the DataLink platform (intervention effect) is studied by comparing the outcome realized by users of the platform (purple line) to an alternate outcome equal in magnitude to that realized by non-users of the platform (red line).
The following table illustrates the DiD estimation calculation for the “Very High Usage” Score 5 cohort.
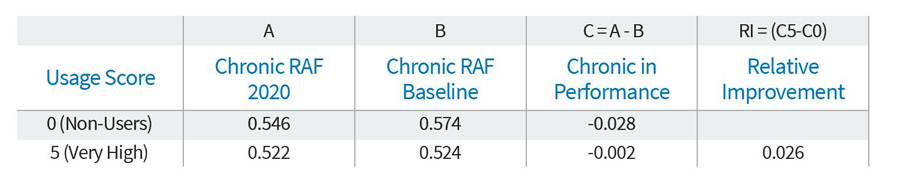
The change in performance (Column C) for each usage group is calculated as the average member Chronic RAF score at the 2020 year-end measurement period (Column A) less the average member Chronic RAF at the baseline measurement period (Column B), or C = A – B. As seen above, the performance of non-users of the DataLink platform (Usage Score 0) deteriorated by a score of (0.028), from a baseline of 0.574 to a 2020 measurement of 0.546. In comparison, the score for very high users of the platform (Usage Score 5) deteriorated far less, from a baseline of 0.524 to 0.522, for a decline of (0.002). The relative performance between the Usage Score 5 cohort and the Usage Score 0 cohort is 0.026 (calculated by comparing the difference in change in performance (Column C), or (0.002) less (0.028)).
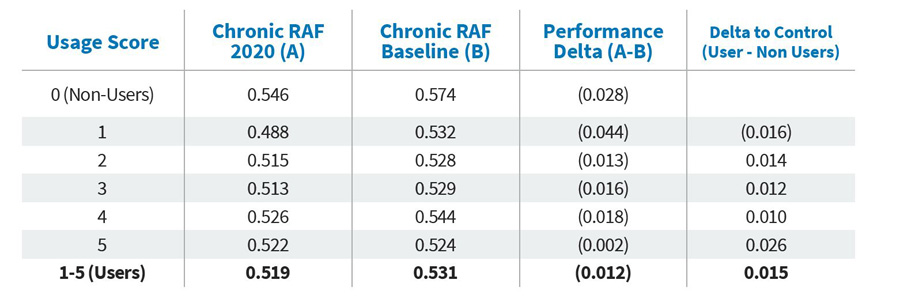
Note that when looking at all user scores in the table below, with the exception of very low users, provider groups using the DataLink platform showed gains over non-users. It is not surprising that scores for all provider groups declined on average compared to the year before they were on the DataLink platform, given the impacts COVID-19 had on visit volumes and providers’ ability to diagnosis and address chronic conditions9. That said, through causal inference, we estimate that users of the DataLink platform realized, on average, a 0.015 higher per patient Chronic RAF score across their payer client’s membership than these same provider groups otherwise would have if they had not utilized the DataLink platform.
VI. Assess robustness and identify confounding factors
Further analysis was performed to assess the robustness and statistical significance of the relative performance improvement found by the difference-in-differences analysis presented above. A series of statistical analyses were performed to assess the robustness and consistency of the relative performance improvement of high Datalink user vs. non-Datalink users and whether any biases might account for improvement, for example, whether the performance improvement is a mere artifact of the mix of providers in the high users vs. non-Datalink users cohorts. Regression analyses and a “nearest neighbor” propensity matching were performed to control for these possible confounding factors. These advanced statistical analyses controlled for many potentially confounding factors, such as provider size, geography, membership age and membership health. This allowed the elimination of these factors as possible alternative explanations of the relative performance improvement found with the difference-in-differences method. The results of these advanced statistical analyses were consistent with the relative performance improvement found with the difference-in-differences method.
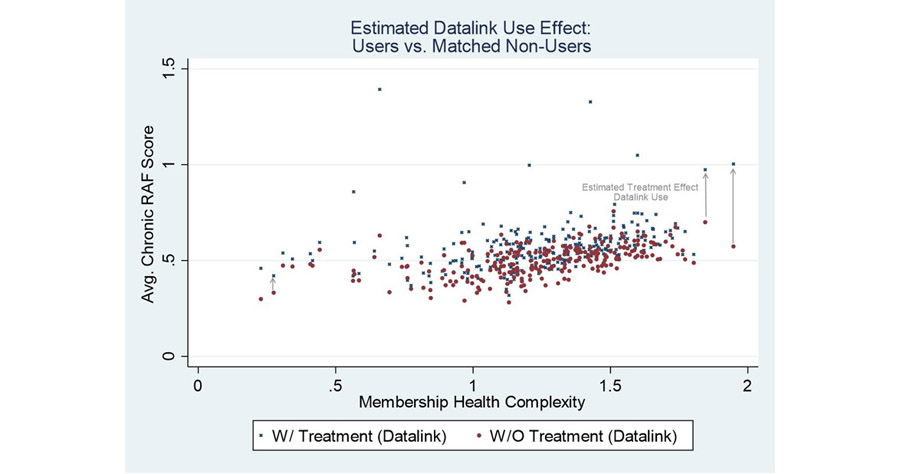
The chart below illustrates the relative performance improvements of Datalink users versus their nearest-neighbor matched non-Datalink user. These relative performance improvements measure the “Datalink Use Effect” on Chronic RAF scores. Red points represent Average Chronic RAF scores for non-Datalink user versus the estimated score with Datalink use (blue points).
VII. Calculate platform ROI
The financial benefit realized from the customer’s use of the DataLink platform was calculated using the computed per-patient Chronic RAF score improvement (0.015) and two key risk adjustment assumptions: the payor’s average contracted bid rate, and the average number of months each member was enrolled during the payment year. For this calculation, we assumed an $850 bid rate and an average enrollment of 11 months. Applied to a full membership population of 100,000 members, for example, the estimated financial benefit of the platform calculation is 0.015 x $850 x 11 x 100,000 and approximates $14 million.
VIII. Estimate full opportunity
The customer is working with DataLink to promote provider engagement and platform adoption over the next few quarters. As more provider groups become users of the platform, the customer will realize returns across a greater population of its membership.
ROI Results
Anyone who has worked with healthcare data knows it's messy. There are an astonishing number of sources and formats, ranging from structured data to paper records to digital videos and other multimedia. Providers, payers, employers, governmental agencies and patients all collect data, but there are significant challenges to unifying information across the industry. Instead, there is divergence and duplication of data, with no single source of “truth.” As a result, what on the surface may feel like a straightforward determination of ROI actually requires a good deal of data analysis to be successful.
At the end of important projects, many organizations reflect on the work and conduct a debriefing or analysis of lessons learned to determine if a project met its objectives and delivered results. In the case of the DataLink customer described above, the answer is a resounding “Yes.” The results of the ROI analysis show that users of the DataLink platform generate a positive ROI — approximately $14 million per 100,000 members, which is an average return of five times their client annual investment.
An ROI of 5:1 might lead some to think the numbers look too good to be true. FTI Consulting and DataLink had that same reaction, and as a test, used the same methodology and repeated the analysis for other clients, with very similar results. It’s a good outcome for all stakeholders:
- DataLink now has statistical support to show clients and prospects that investment in the platform is a sound financial decision, and they have a methodology in place to measure platform performance as new features and functionality are added to the system.
- Purchasers of the platform have data they can take to leadership that supports the soundness of the investment, and they have the knowledge that their population health programs are having the intended, positive impact on insured members.
- Providers using the system to facilitate patient visits know that their platform engagement should produce higher quality care and ensure more complete assessments of their patients’ health conditions.
Bottom Line
The bottom line is that differentiating winners from losers in highly competitive markets can be a small margin, and often the winners have great operational discipline. They demand performance and accountability from their organization and their business partners alike, and a robust vendor management process includes measurement of operational and financial returns.
It is common for service providers to quote estimated ROI calculations based on a series of assumptions. However, health plans and other organizations contracting for services and technology should demand more. DataLink and FTI Consulting proved that it is possible to measure the actual financial benefit of using a product or service. Given the intense competition and low margins, health plans should demand vendors provide ROI figures as part of their regular performance reporting.
Footnotes:
1: National Healthcare Expenditures. Projected, Table 17 Health Insurance Enrollment & Enrollment Growth Rates, Calendar Years, 2012-2028. Centers for Medicare & Medicaid Services. https://www.cms.gov/research-statistics-data-and-systems/statistics-trends-and-reports/nationalhealthexpenddata/nationalhealthaccountsprojected
2: Ibid.
3: Medicare Advantage in 2021: Enrollment Update and Key Trends. KFF; June 21, 2021. https://www.kff.org/medicare/issue-brief/medicare-advantage-in-2021-enrollment-update-and-key-trends/
4: Medicare Advantage 2021 Spotlight: First Look. KFF; October 29, 2020. https://www.kff.org/medicare/issue-brief/medicare-advantage-2021-spotlight-first-look/
5: Ibid.
6: A Dozen Facts About Medicare Advantage in 2020. KFF; January 13, 2021. https://www.kff.org/medicare/issue-brief/a-dozen-facts-about-medicare-advantage-in-2020/
7: FTI Consulting analysis of CMS Medicare Advantage Enrollment Files, 2021
8: Health Insurers Financial Insights, Volume 2 Fall 2019/Winter 2020, Oliver Wyman. https://www.oliverwyman.com/content/dam/oliver-wyman/v2/publications/2020/February/OW_Health_Insurer_Financial_Insights_Vol2.pdf
9: The Impact of COVID-19 on Outpatient Visits in 2020: Visits Remained Stable, Despite A Late Surge in Cases. The Commonwealth Fund; February 22, 2021 https://www.commonwealthfund.org/publications/2021/feb/impact-covid-19-outpatient-visits-2020-visits-stable-despite-late-surge
Related Insights
Related Information
Published
February 28, 2022
 Key Contacts
Director