From Coverage to Cash Flow
The New Playbook For European Fibre
-
April 27, 2026
Downloads Download Article
-

After more than a decade of accelerated deployment, fibre is no longer a growth-at-any-cost infrastructure story. Returns are now determined by monetisation, capital discipline and the ability to generate contracted cash flows. This represents a shift in the investment thesis, which is playing out in different ways for fibre-to-the-home (“FTTH”) and B2B fibre.
In FTTH, fibre coverage across most major European markets has increased significantly, yet penetration and utilisation remain significantly below expectations.1 At the same time, the cost of capital has normalised at structurally higher levels, exposing the limitations of business models built on optimistic take-up assumptions and speculative terminal value.
This is driving the shift in value creation from network growth to penetration-driven strategies, operational execution and consolidation of sub-scale and overbuilt platforms. This is accelerating the rise of wholesale-only, multi-ISP models and a financing shift toward yield-oriented, asset-backed structures supported by long-term institutional capital.
In B2B fibre, demand dynamics are being reshaped by structurally different drivers. AI workloads, data-centre consolidation and rising enterprise requirements for low-latency, high-capacity connectivity are favouring dense metropolitan footprints, scalable backbone and interconnection assets as well as managed services beyond simple connectivity.
Despite these different demand profiles, both segments are uniting along the same capital logic, with investment focus moving decisively from:
- Build metrics to monetisation and utilisation metrics
- Network expansion to penetration, yield and operational discipline
- Speculative growth to revenue visibility and contracted cash flows
Taken together, these dynamics mark a permanent shift in how fibre assets are valued and financed. European fibre is no longer an expansion story. It is an infrastructure optimisation, consolidation and yield story.
FTTH: Analysis of Current Scenario and Future Trends
The Growth Phase: Buildout Dynamics (2016-2021)
Capital intensity and coverage-driven investment
Between 2016 and 2021, European fibre investment was dominated by rapid coverage expansion. Abundant infrastructure capital, strong public policy support for gigabit connectivity and confidence in long-term demand drove unprecedented deployment intensity.2, 3 The core investment logic was simple: build coverage quickly, acquire subscribers over time and scale revenues.
This approach was reinforced by public policy, with EU and national strategies prioritising network availability and measuring success through coverage targets.4, 5 The Gigabit Society framework linked economic and social benefits to widespread deployment, while the Broadband State Aid Guidelines supported public intervention where market forces were insufficient.
The result was a deployment-led market structure in which coverage expansion, rather than commercial performance, became the primary measure of success.
Build metrics dominated success narratives
As a result, fibre success was judged mainly on rollout execution. Homes passed, build speed and cost per home passed dominated KPIs and investor narratives, while commercial metrics such as penetration, churn, ARPU quality and customer lifetime value were assumed to follow once coverage was secured.
In Europe, hundreds of local operators embarked on independent or semi-coordinated builds, resulting in coverage redundancy in attractive areas and underserved rural areas.6, 7 By 2022, Europe made substantial progress in the expansion of FTTH/B coverage.8 The economics of the build-out phase masked the underlying issues that would eventually reprice the sector.
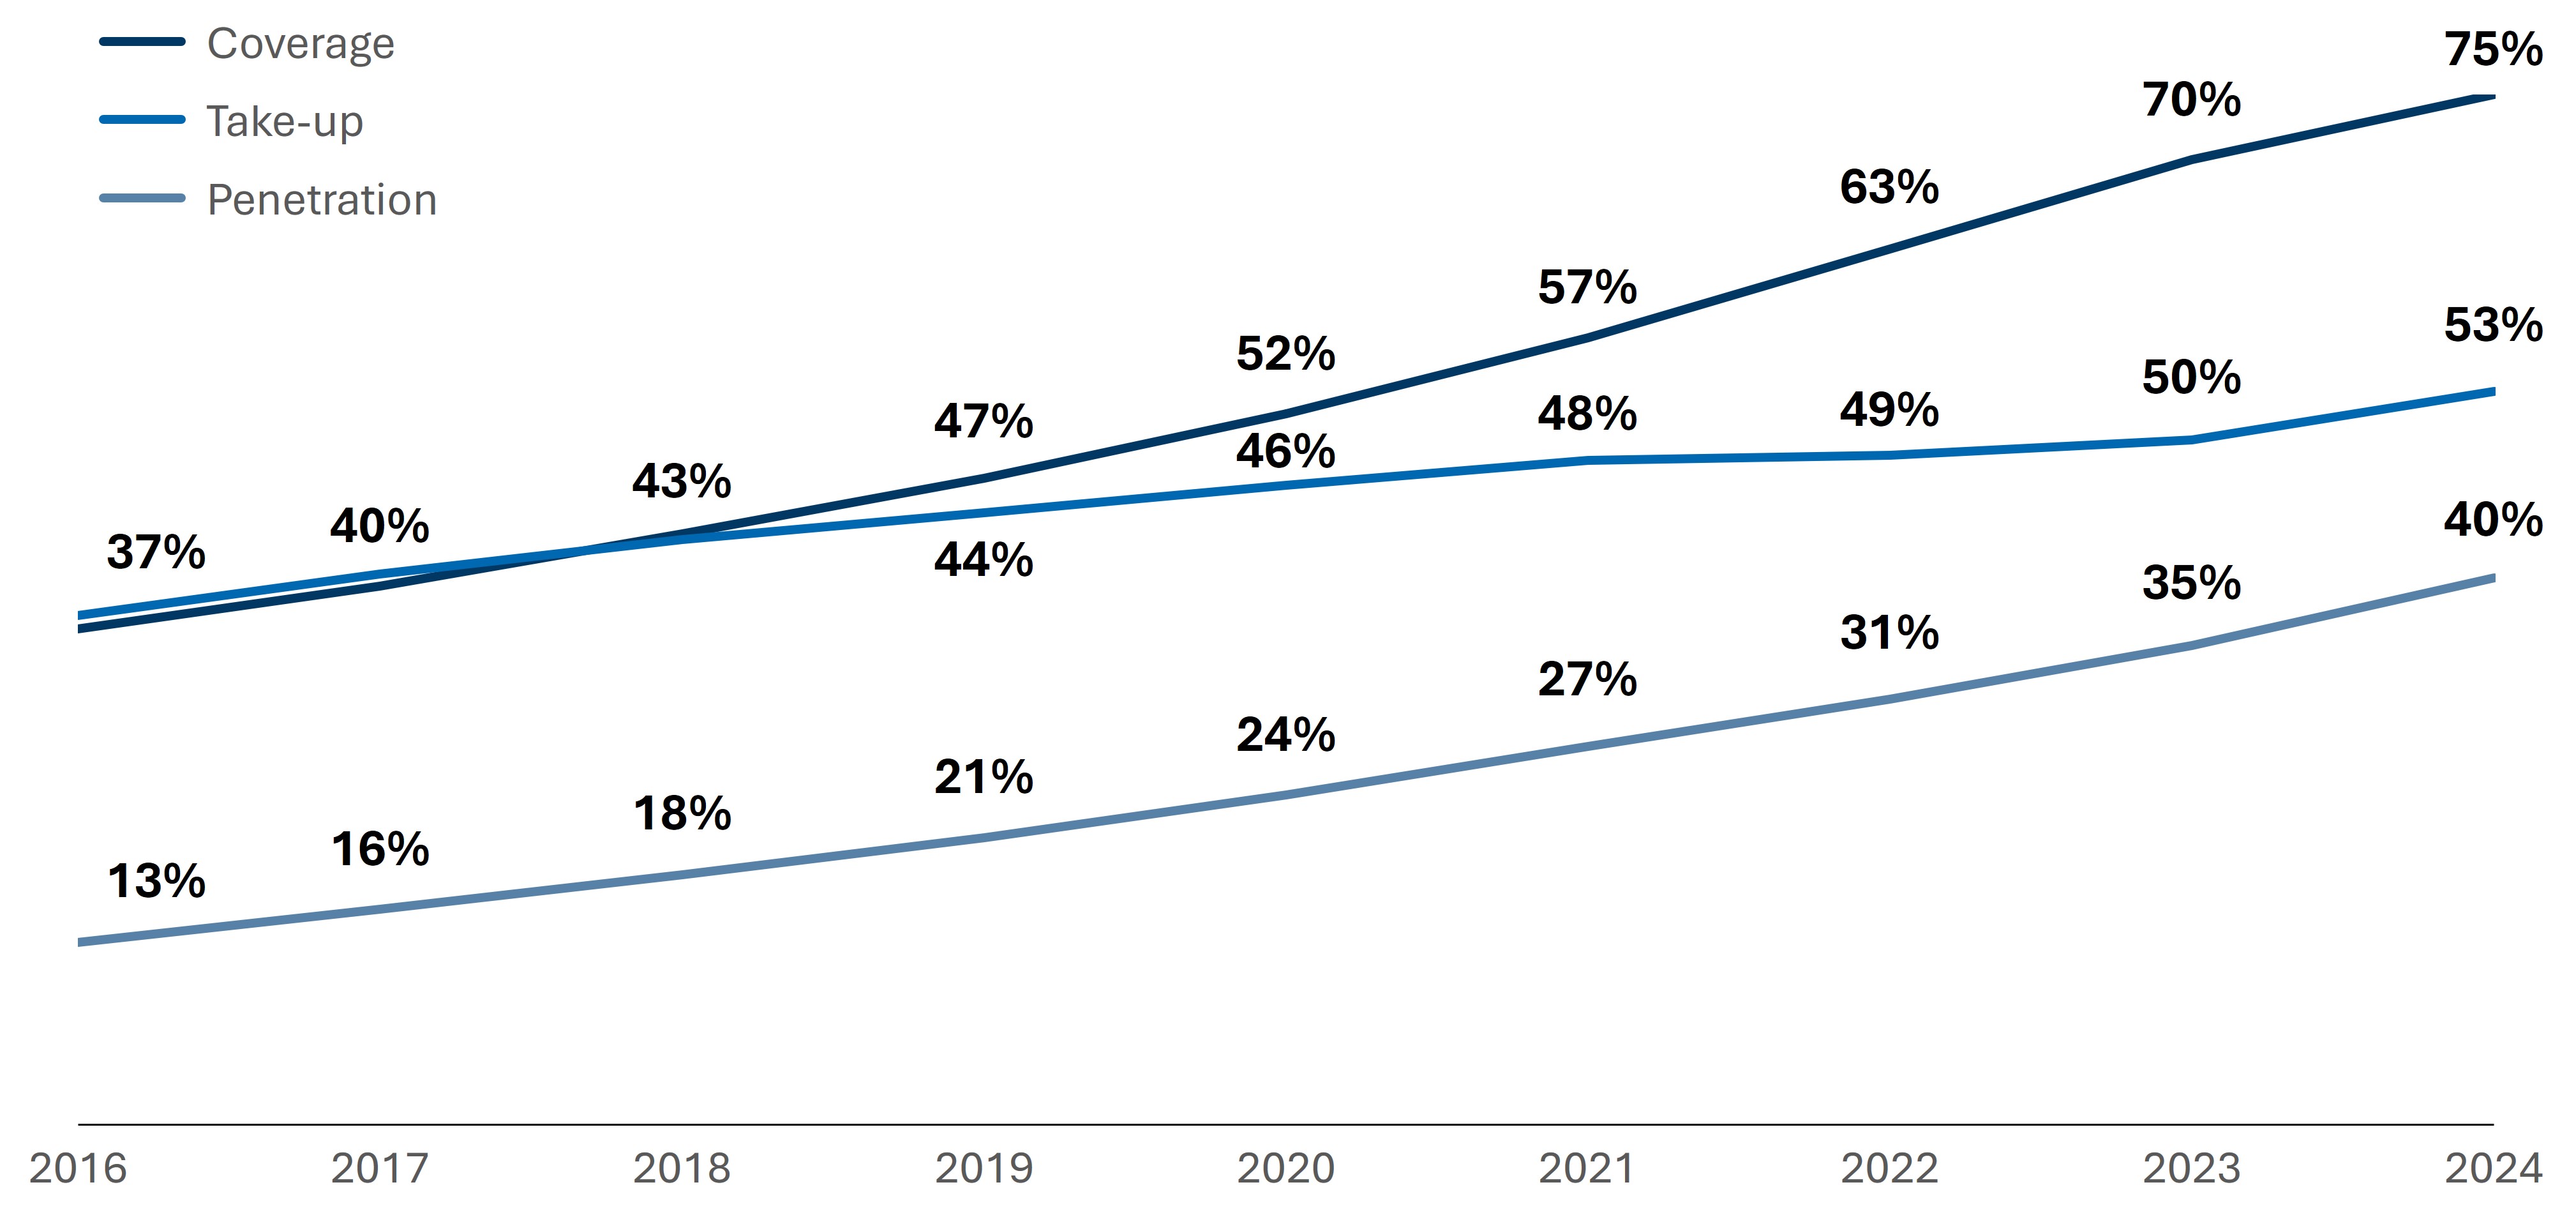
Figure 1 – FTTH Coverage, Take-Up and Penetration in Europe – FTTH Council Europe9
The Inflection Point: Overbuild, Penetration Lag, Returns Pressure and Policy Recalibration (2021–2024)
The coverage-penetration gap
By the early 2020s, a structural mismatch became increasingly visible: FTTH coverage was rising rapidly, but penetration was not keeping pace. By September 2024, EU39 FTTH/B coverage reached 75%, while take-up stood at 53%. However, penetration (homes connected as a share of total homes) was still around 40%. In many markets with 70–80% availability, penetration remained in the 30–45% range, with only a few above 50%.10
This gap exposed the fundamental flaw in the buildout-centric model. You can build the fibre, but you cannot assume they will come. Penetration, not coverage, is the true driver of returns.
The overbuild problem and capital discipline
Accelerated deployment led to a lot of network duplication, especially in dense and economically attractive areas. With several networks competing for the same customers, customer acquisition costs escalated. In regions with overbuilding, the payback periods increased, and the returns on investment fell short of the original business projections.11
Overbuild, especially from the incumbents, not only challenged the take-up rate of altnets, but it also diluted unit economics and exposed the limits of unconstrained competitive deployment.
The increase in the cost of capital
From 2022 onward, rising interest rates fundamentally altered the investment equation. Higher rates and wider credit spreads increased discount rates, penalising long-dated and back-ended cash flows.12
Projects that appeared attractive in a low-rate environment became difficult to refinance or justify under normalised capital costs. Leverage capacity declined, refinancing risk increased and investors became less tolerant of uncertainty around penetration and pricing. The perception of FTTH as a low-risk and predictable infrastructure asset was challenged. What was once survivable under cheap capital became structurally unfinanceable under normalised rates.
The shift did not create structural weaknesses in fibre economics, but it revealed them.
Stakeholder Recalibration: What Equity, Debt And Operators Now Require
Equity investors: from scale to execution
Equity investors have made a clear shift away from scale-driven valuation stories.13 Coverage alone no longer commands premium multiples. Instead, investors prioritise penetration momentum, credible commercial execution, operational leverage and visibility to free cash flow.
Assumptions about penetration are now under intense scrutiny, with more emphasis on demonstrated go-to-market playbooks and conservative growth profiles. The source of value is shifting from build to integration, cost savings and utilisation maximisation. One of the critical questions that investors are asking is what can be done to attract national ISPs on board the network through a shift in strategy from retail to wholesale.
Lenders: Visibility, structure and downside protection
For lenders, underwriting now centres on revenue certainty and downside protection. Financing terms vary materially based on asset maturity, penetration levels and contractual visibility.
The key areas of focus are contracted revenues, anchor tenants, strong covenants through a thorough review of KPIs set in a ‘milestone-based’ approach and refinancing flexibility. Consolidation strategies that decrease competitive forces and stabilise cash flows are considered positively.
Operators: From build excellence to monetisation excellence
Operators now face a commercial execution challenge. As coverage build matures, value creation is increasingly driven by execution of underutilised commercial levers rather than network expansion. In line with the FTI Consulting’s VC Index, the most immediate sources of value lie in reducing churn, improving activation and sales effectiveness, strengthening wholesale engagement and investing in scalable OSS/BSS and partner management capabilities.14
Wholesale platforms with significant scale, simple products, transparent pricing and professionalised ISP engagement perform better than wholesale platforms that are still evaluating a strategy shift from a retail to a wholesale strategy.
FTTH Trends: Consolidation, Wholesale Models And Transition to Yield
Consolidation of overbuilt and sub-scale FTTH networks
In markets such as the UK, the first generation of FTTH deployment has created a fragmented market structure with several small-scale operators having sub-scale networks, ultimately leading to higher cost per subscriber and limited pricing power.15, 16, 17
Figure 2 – Value of The Target FibreCo in The Event of Consolidation – FTI Consulting Analysis
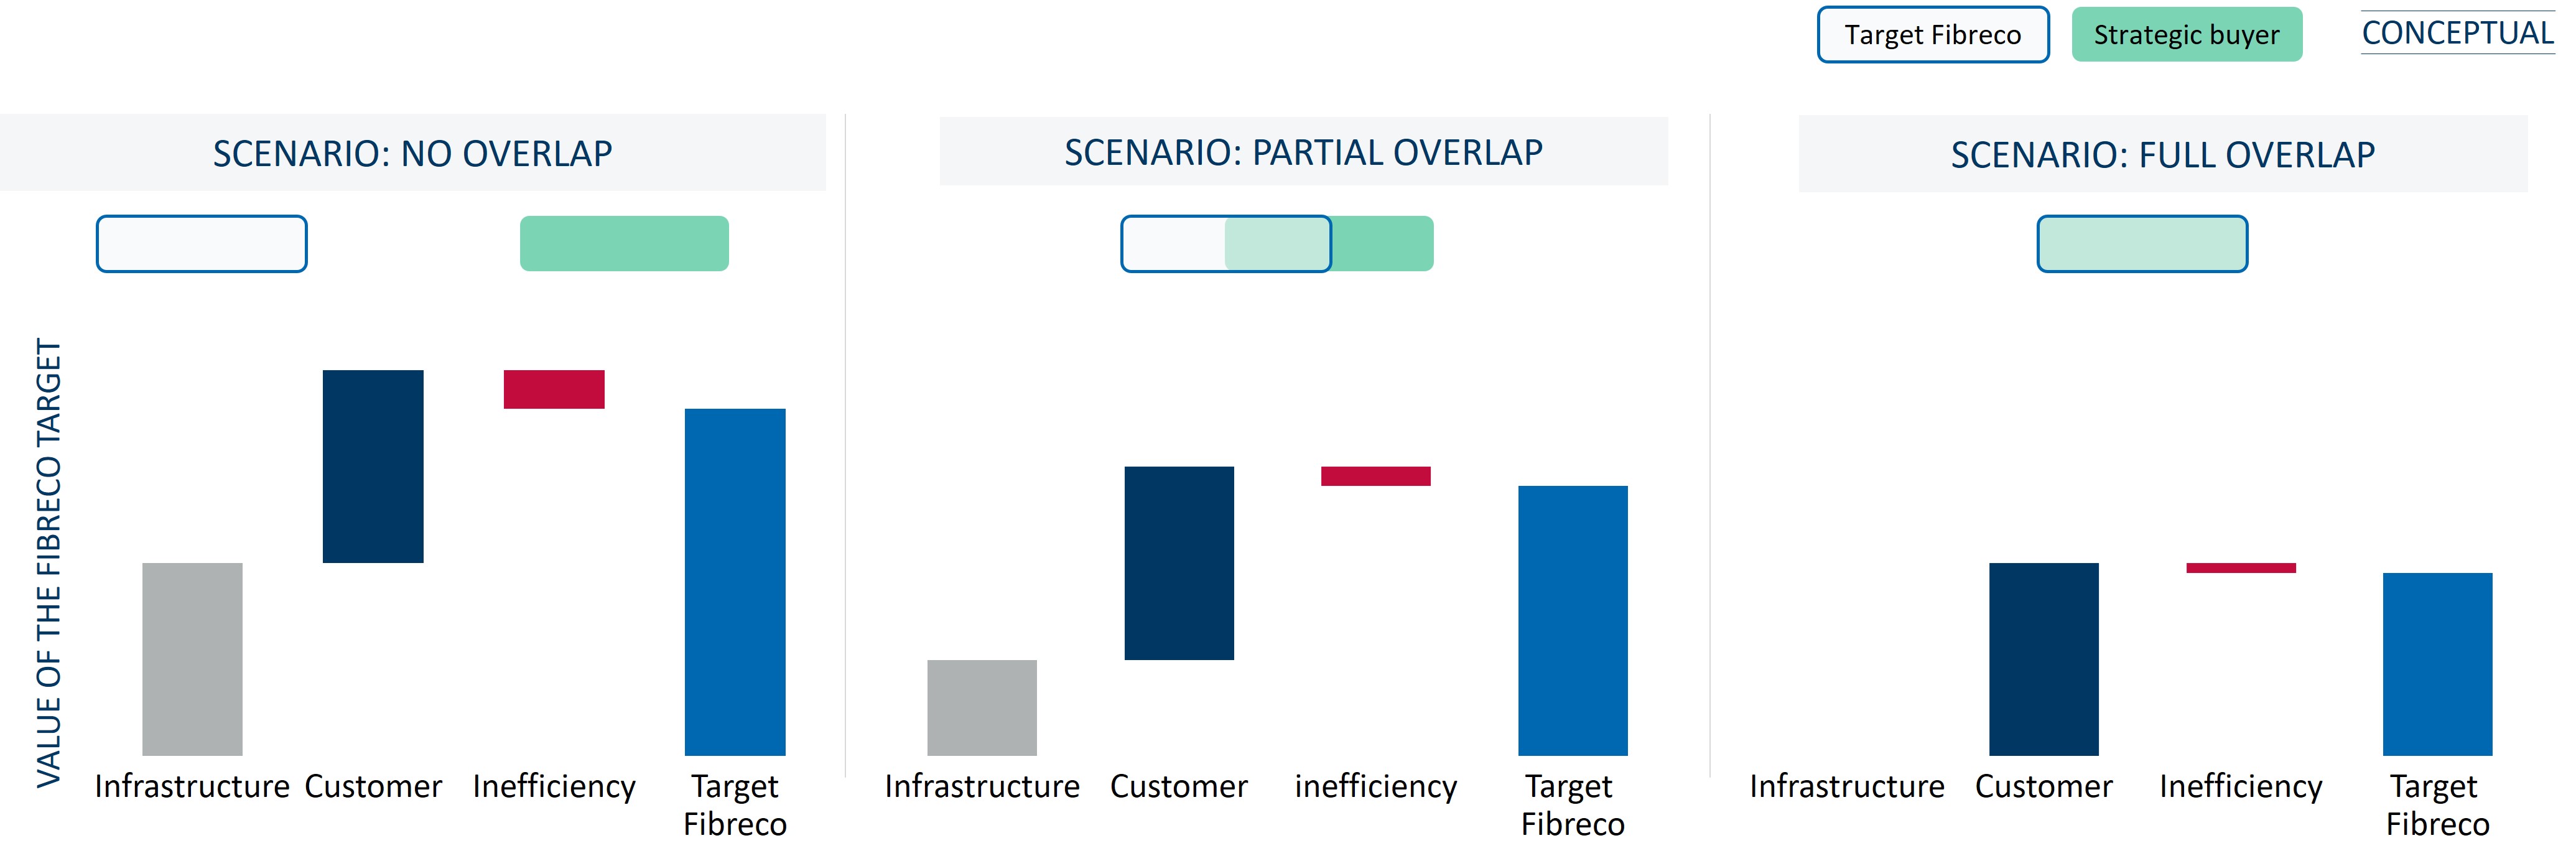
The value of a FibreCo to a strategic buyer depends on how much the two networks overlap. Where there is no overlap, a transaction typically reflects payment for both the infrastructure and the customer base. In overbuilt areas, where networks overlap, sellers may still attribute value to the infrastructure, but buyers have little reason to pay for duplicated assets, leading to potential valuation mismatch.
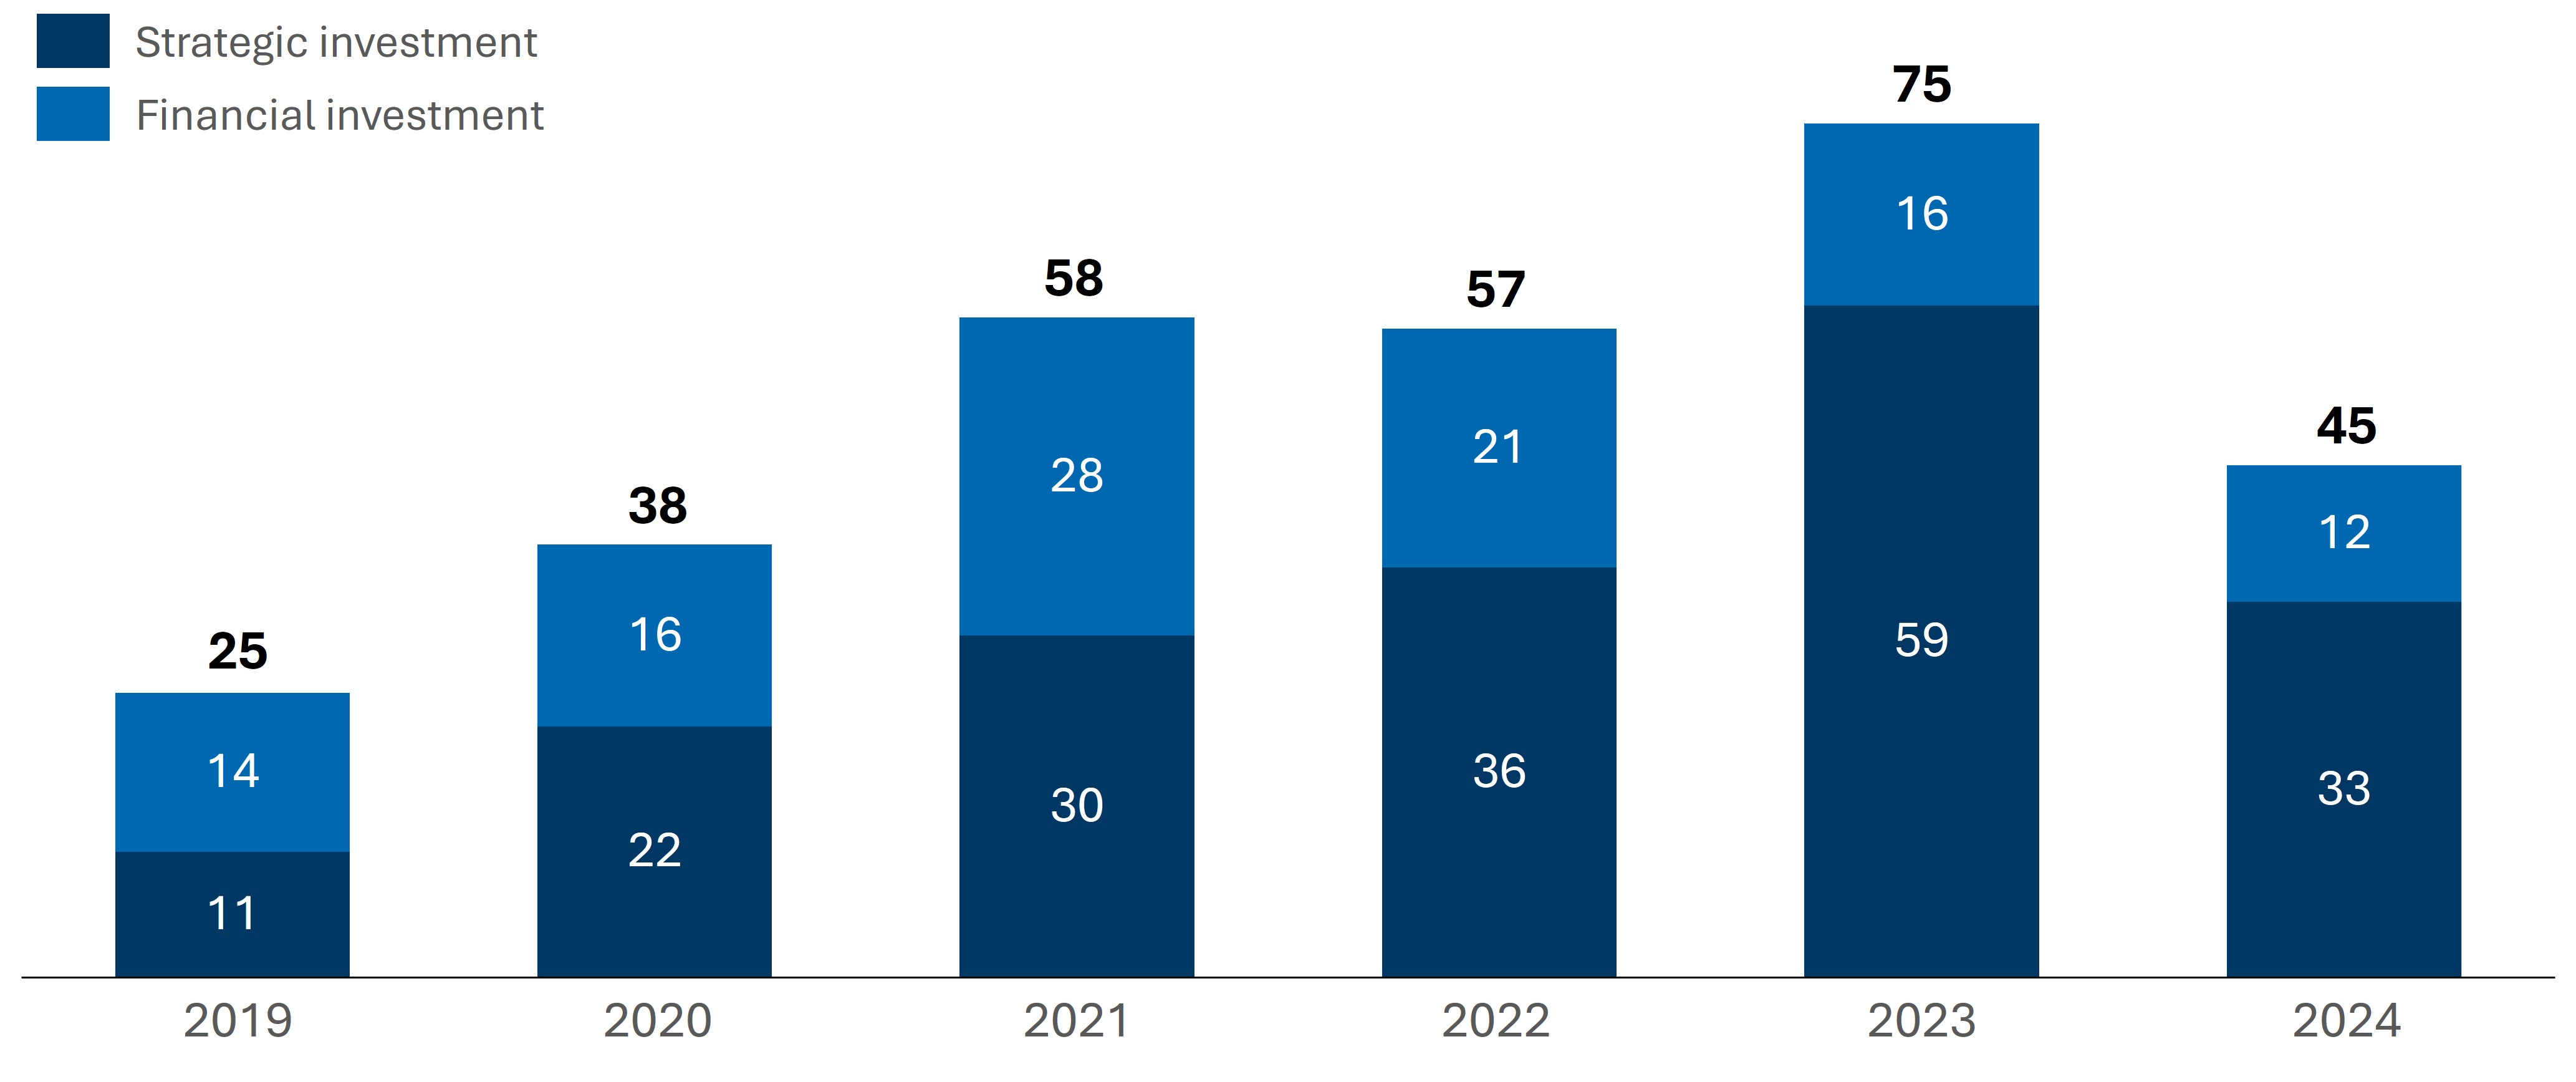
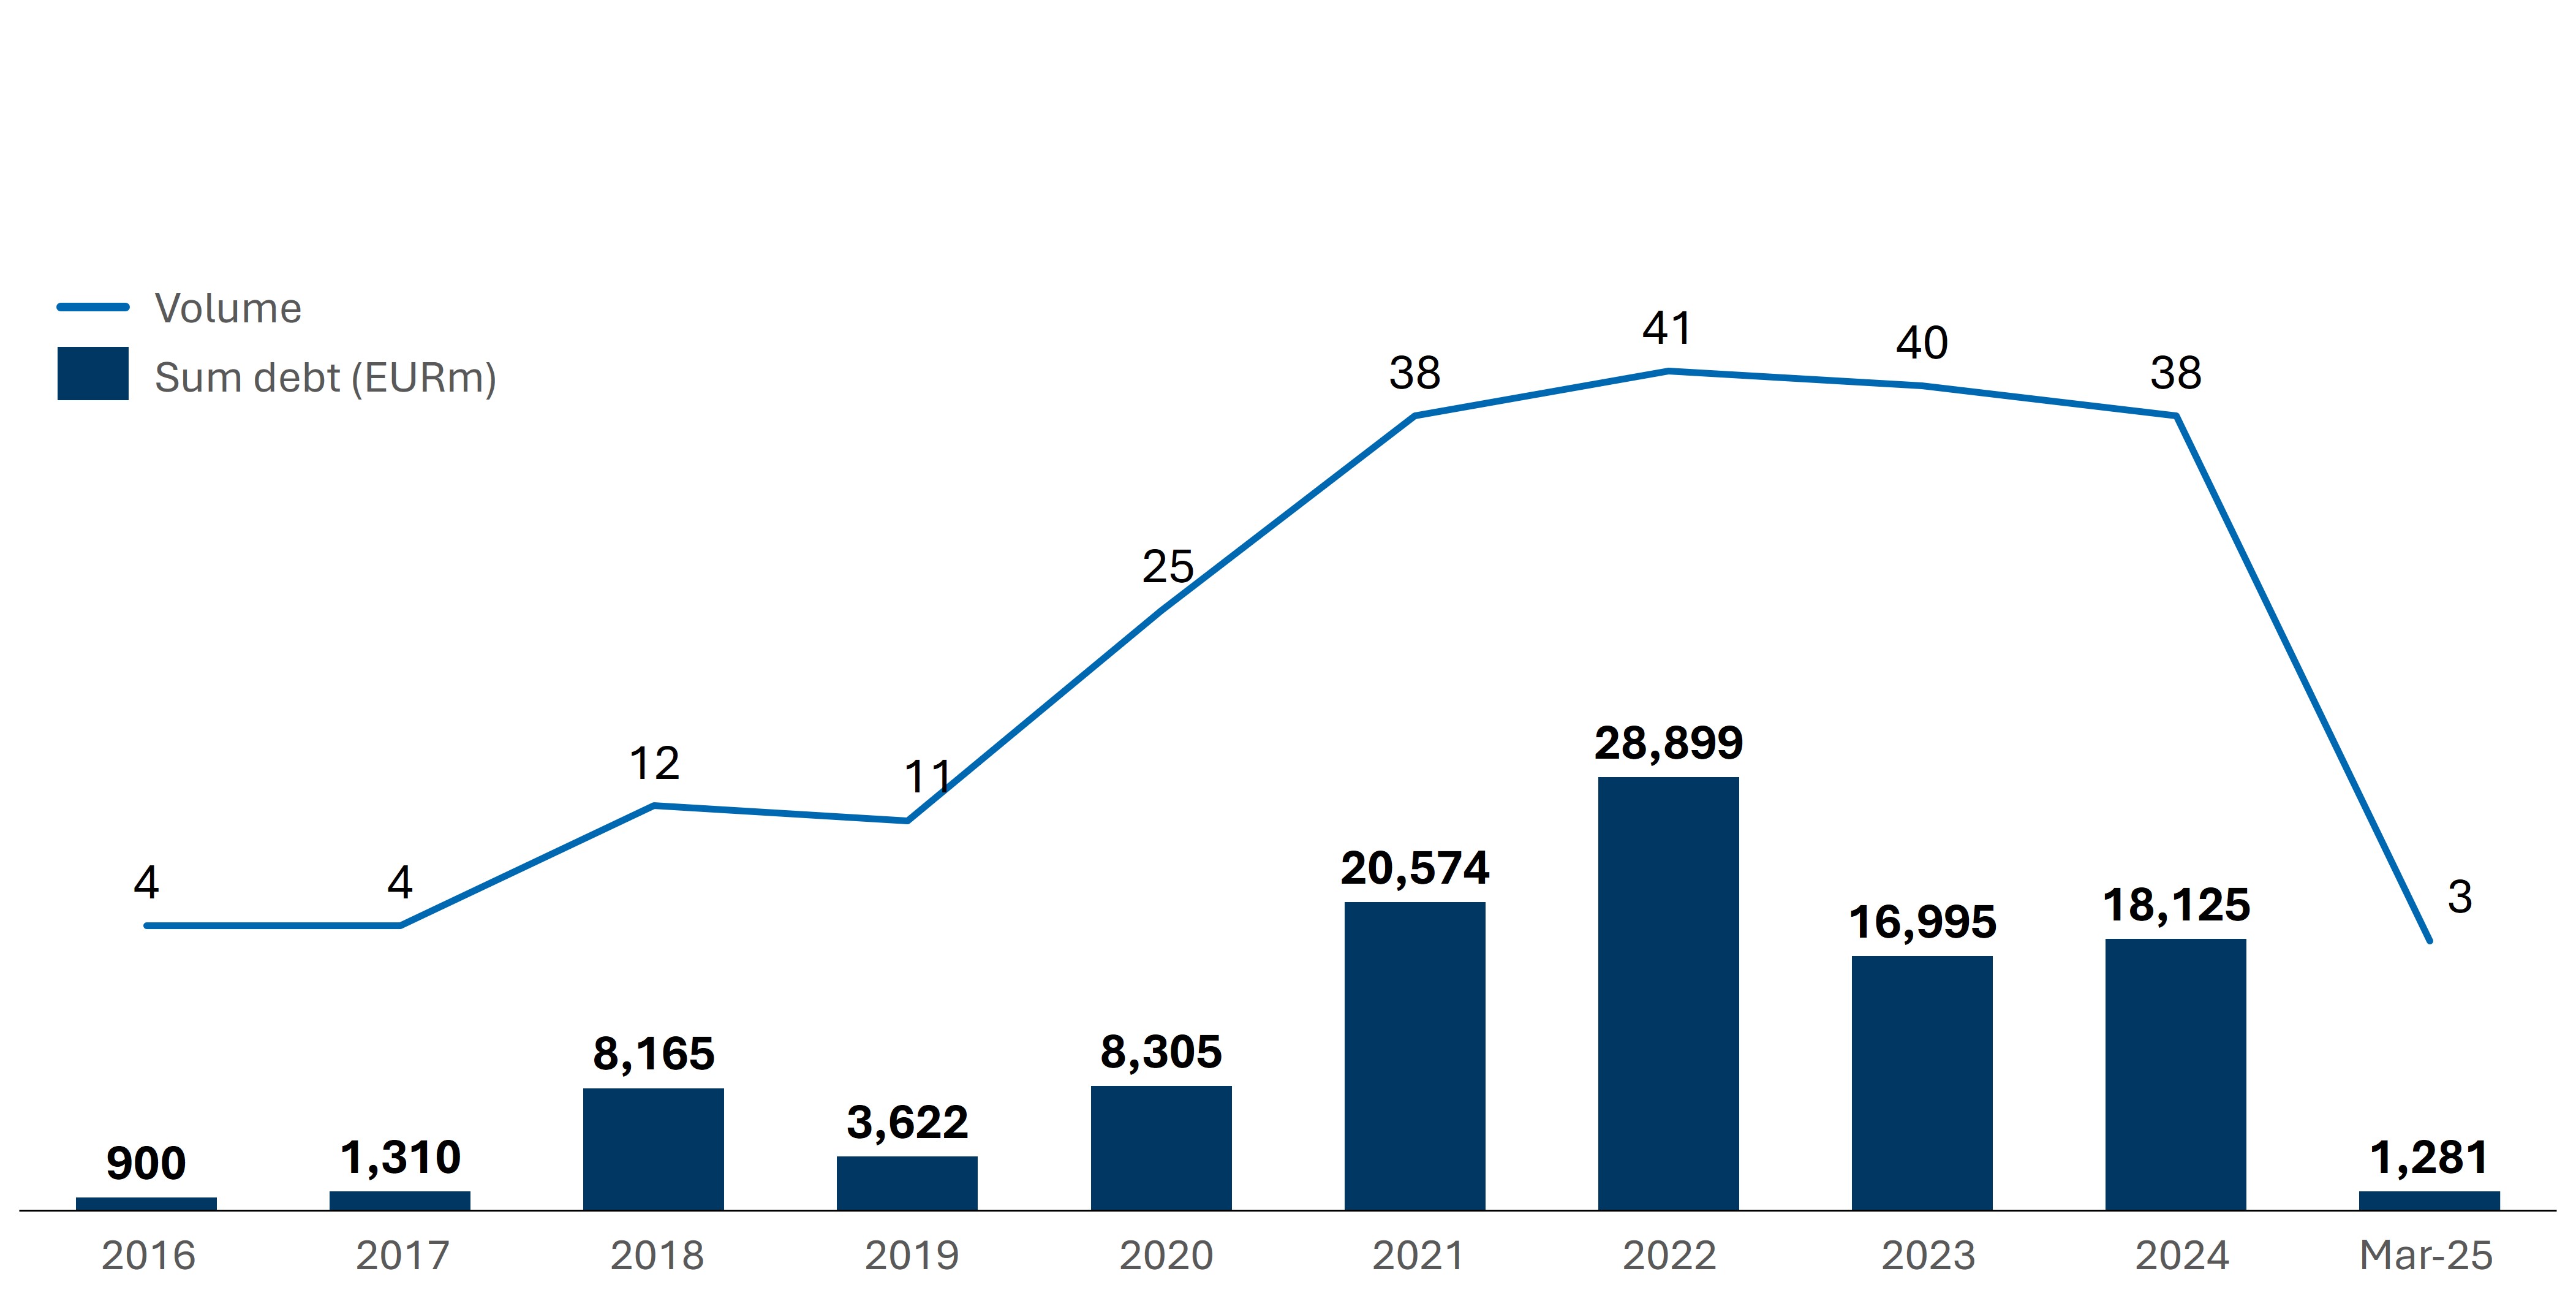
Figure 3 – Fixed Broadband M&A Deals in Europe (Publicly Available) – TMT Finance18
Consolidation is occurring through:
- M&A, combining overlapping footprints and eliminating duplicated infrastructure
- Asset aggregation, separating passive assets from retail operations
- Wholesale transition, with sub-scale operators exiting retail and focusing on infrastructure
In the UK, analysts expect altnet consolidation to accelerate in 2026, largely because investors are losing patience with underperforming business models that rely on constant capital injections. They believe that as more altnets face financial distress, especially those
Unable to service debt or generate meaningful cash flow, debt restructurings will trigger a wave of asset sales. Analysts see this as a necessary step to unlock M&A activity, particularly in overbuilt or sub-scale networks.19
In our view, the long-term FTTH market structure will be shaped primarily by the trade-off between Cost Per Premise Passed (“CPPP ”) and take-up. As capex rises, moving from dense urban areas to rural and subsidised geographies, unit economics weaken and the number of economically sustainable infrastructure players declines. Over time, this cost naturally drives consolidation, with markets converging toward a small number of scaled platforms and, in the highest-cost areas, monopoly or quasi-monopoly structures.
Wholesale-only models with multiple ISPs
Wholesale-only, open-access FTTH has emerged as the dominant maturity model. The advantage of a platform supporting multiple ISPs is that it enjoys higher utilisation, more diversified revenues and a better-defined risk profile of the infrastructure.
However, wholesale is not a guarantee of performance. Returns are driven by execution quality of a scaled network: simple and standardised wholesale products, transparent pricing, scalable Operating Support Systems/ Business Support Systems (“OSS/BSS ”) and diverse ISP partner selection and management.
Figure 4 – Possible Business Models for Vertically Integrated FTTH Players – FTI Consulting Analysis
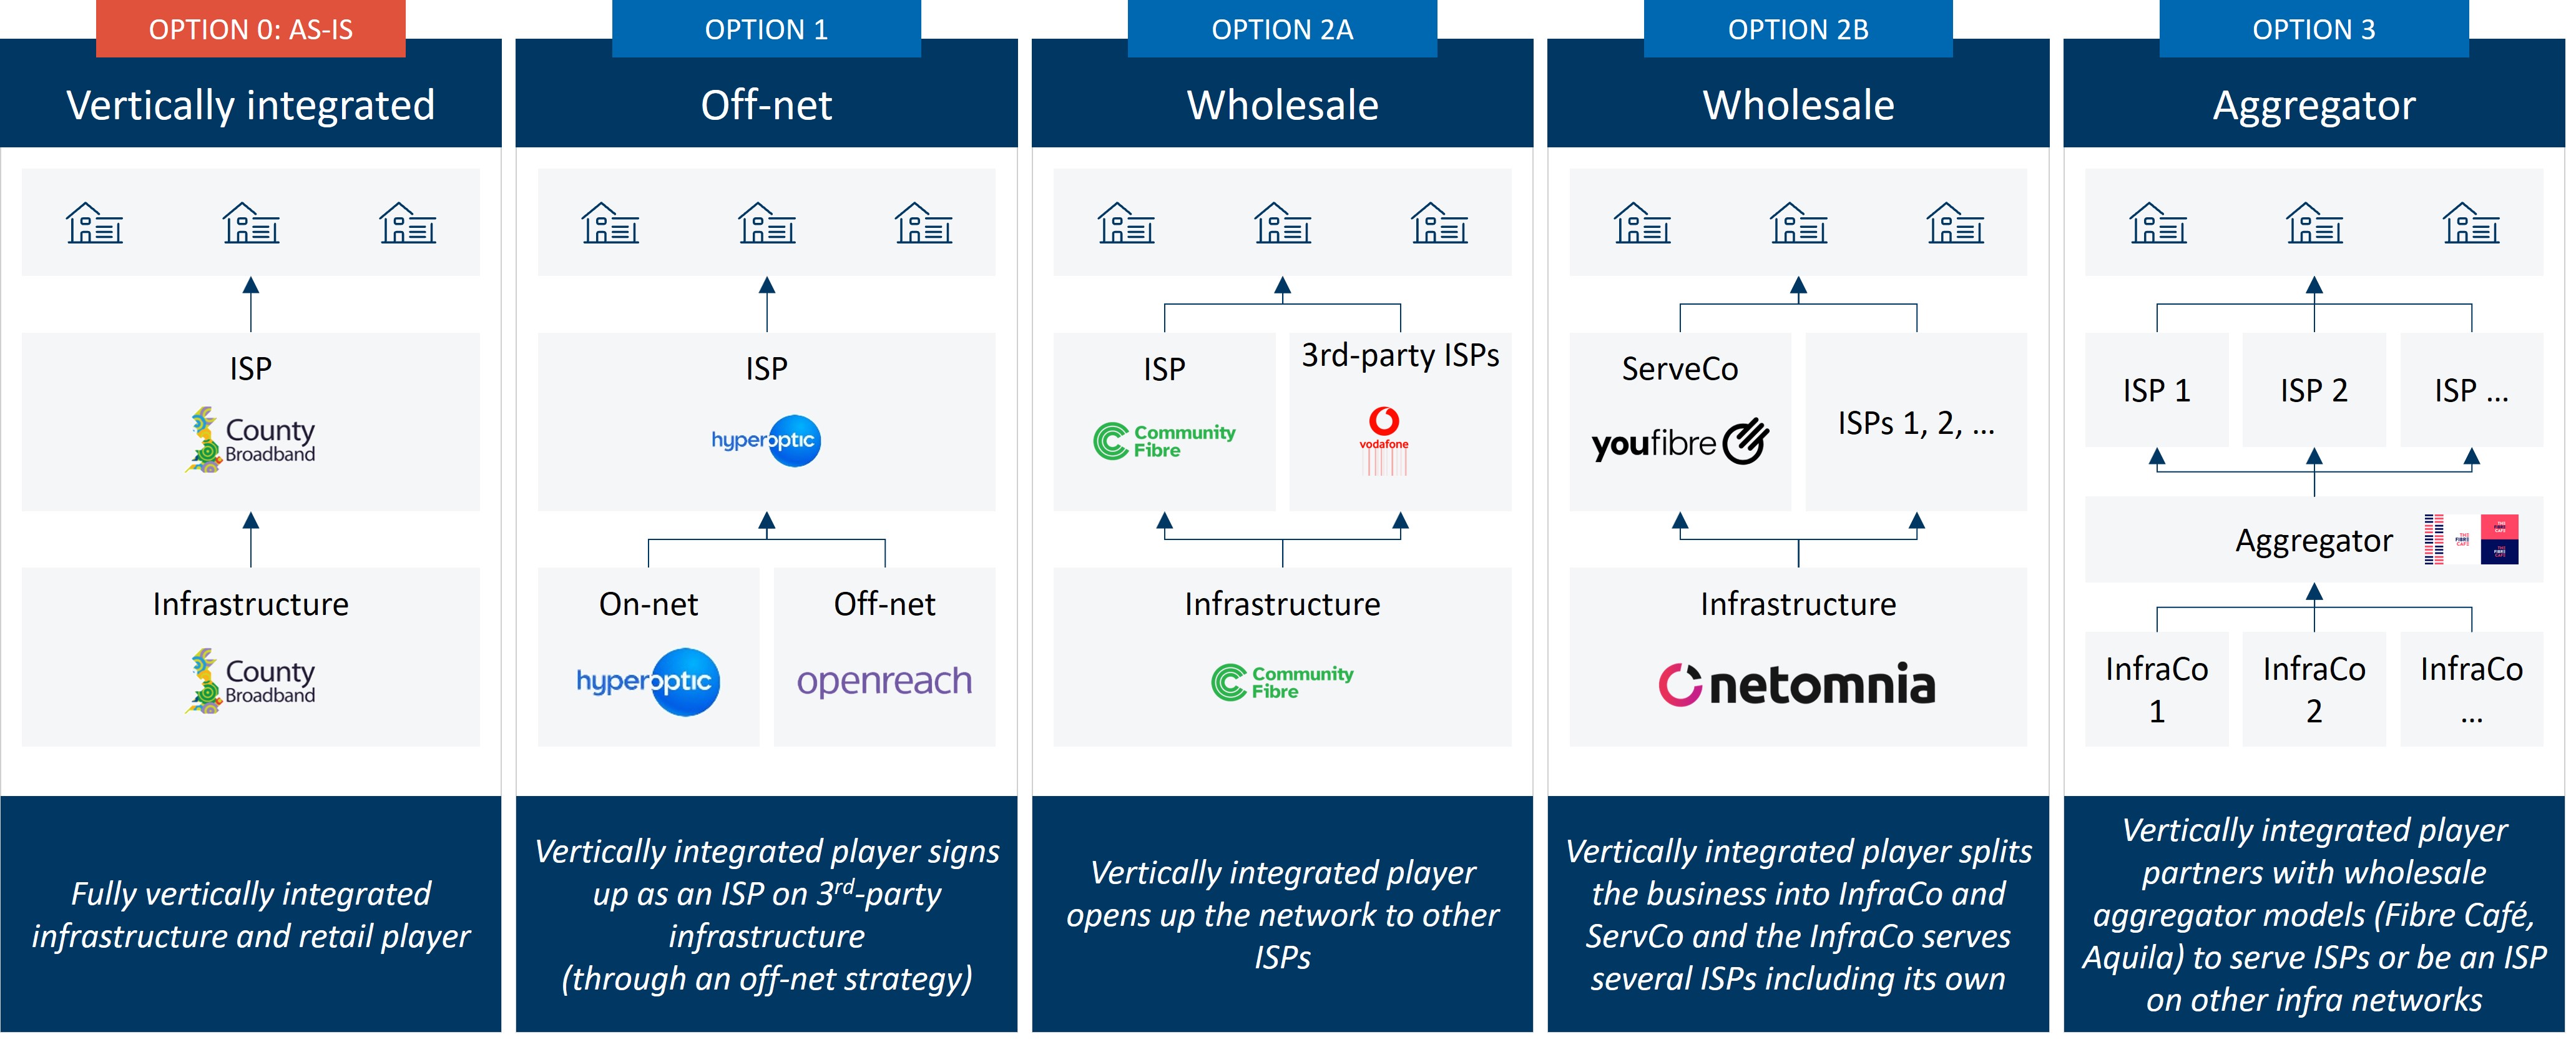
Vertically integrated FTTH operators are already moving towards wholesale and aggregation business models as markets mature. This means that off-net strategies will be used more and networks will be opened to third-party ISPs, structural separation between infrastructure and service providers and eventually aggregation on multi-fibre platforms. Platforms that rely on regulatory protection or anchor ISP tenants tend to underperform. Those that grow penetration organically through commercial execution command superior valuations.
From speculative builds to stable cash-flow assets
As FTTH networks mature, financing is shifting from build-risk funding to cash-flow-underwritten infrastructure-style structures, enabling lower cost of capital, longer tenors and higher leverage.
However, FTTH represents only one part of the European fibre landscape. A parallel evolution is underway in B2B fibre, shaped by structurally different demand drivers and connectivity requirements.
Figure 5 – Financing & Greenfield FTTH Transactions in Europe (EURm) – FTTH Council Europe20
B2B Fibre Trends: AI, Data Centres and Contracted Connectivity
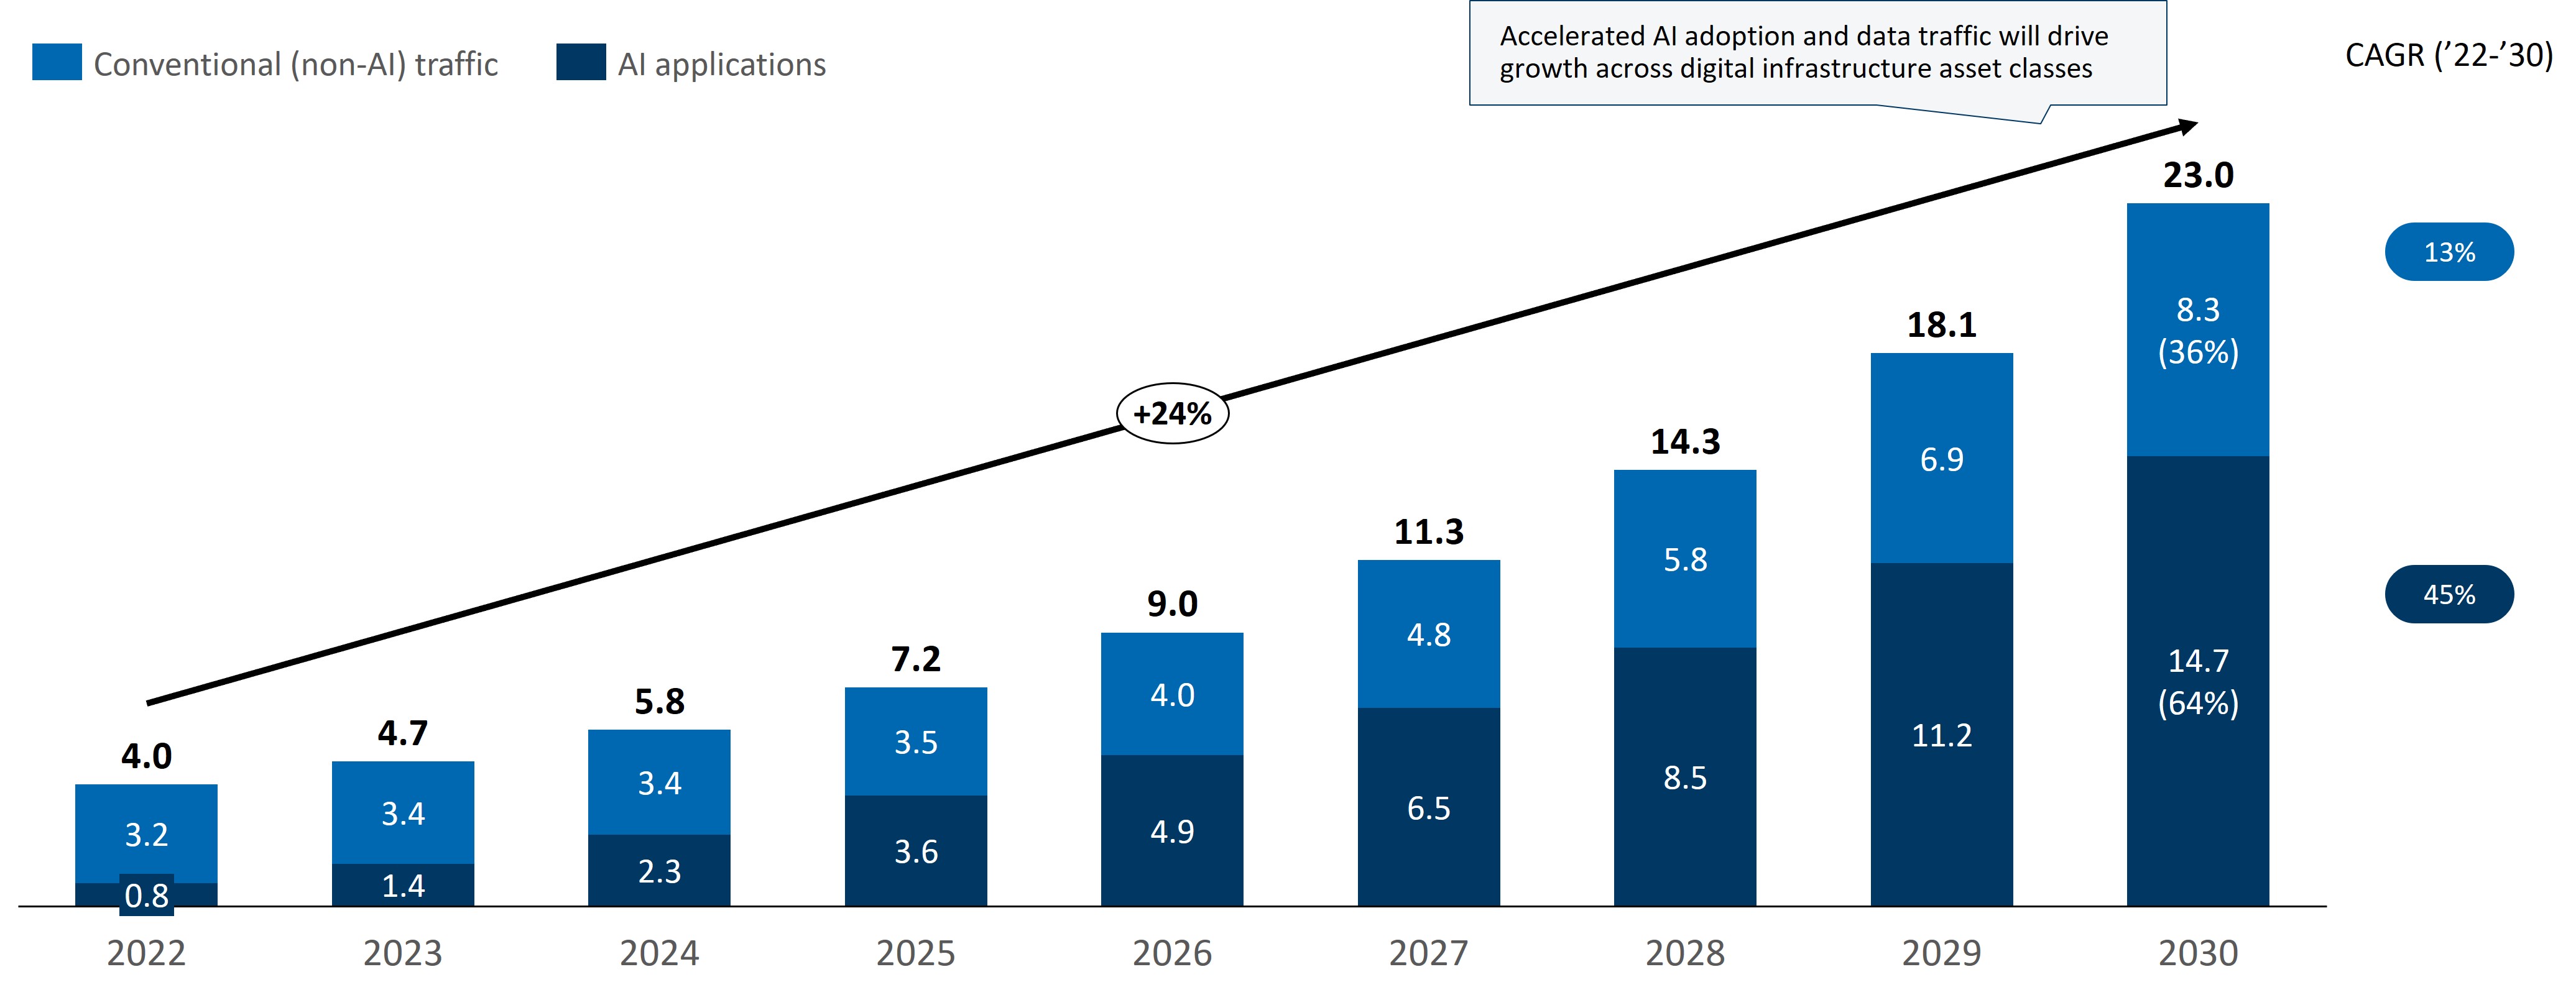
AI as the primary demand engine
AI infrastructure is now the leading structural driver of B2B fibre demand. Large-scale training and inference workloads require connectivity that is high-capacity, ultra-low-latency, highly resilient and contractually assured, fundamentally changing both the volume and the quality of fibre demand.
Unlike traditional enterprise traffic, AI workloads are latency-sensitive, reliability-critical and continuous, driving sustained demand for dense metro fibre, data centre interconnection and long-haul capacity between compute clusters.
Figure 6 – Global Network Traffic Forecast (Zettabytes Transferred Per Year)
Dense metropolitan areas and enterprise connectivity
Capital is concentrating in dense metropolitan fibre networks, where utilisation ramps faster, customers are stickier, pricing power is stronger and barriers to entry are higher. City-scale platforms are increasingly leveraging the same infrastructure to monetise multiple high-value customer segments. The key demand drivers that are driving this trend are:
- Mobile Network Operators (“MNOs ”) requiring fibre for densification of 5G Advanced and future 6G fronthaul and backhaul
- AI-centric data centres (“DCs”) and interconnection points, requiring ultra-low latency and high-capacity connectivity
- Enterprises seeking fibre connectivity services guaranteed by Service Legal Agreement (“SLA ”) as opposed to best efforts
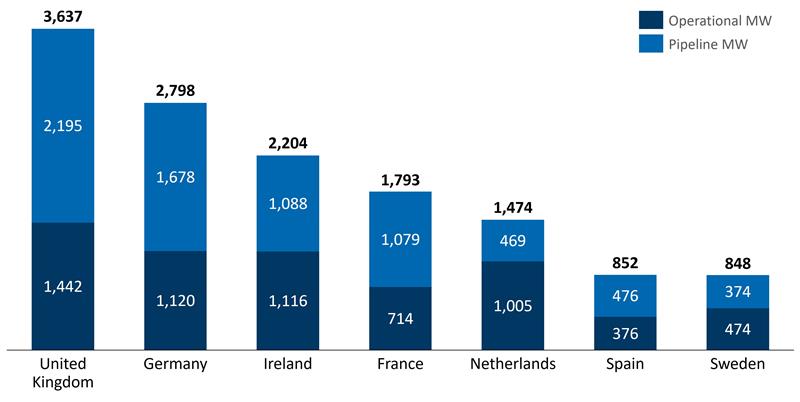
Figure 7 – EMEA Data Centre Capacity: Operational vs Pipeline by Country (2024)21
Fibre-to-the-Datacentre and interconnection ecosystems
Fibre-to-the-Datacentre (“F2DC”) has emerged as a new and fast-growing segment, focused on high-capacity, low-latency connectivity between data centre clusters. AI workloads amplify this demand due to latency sensitivity, reliability requirements and operational complexity.
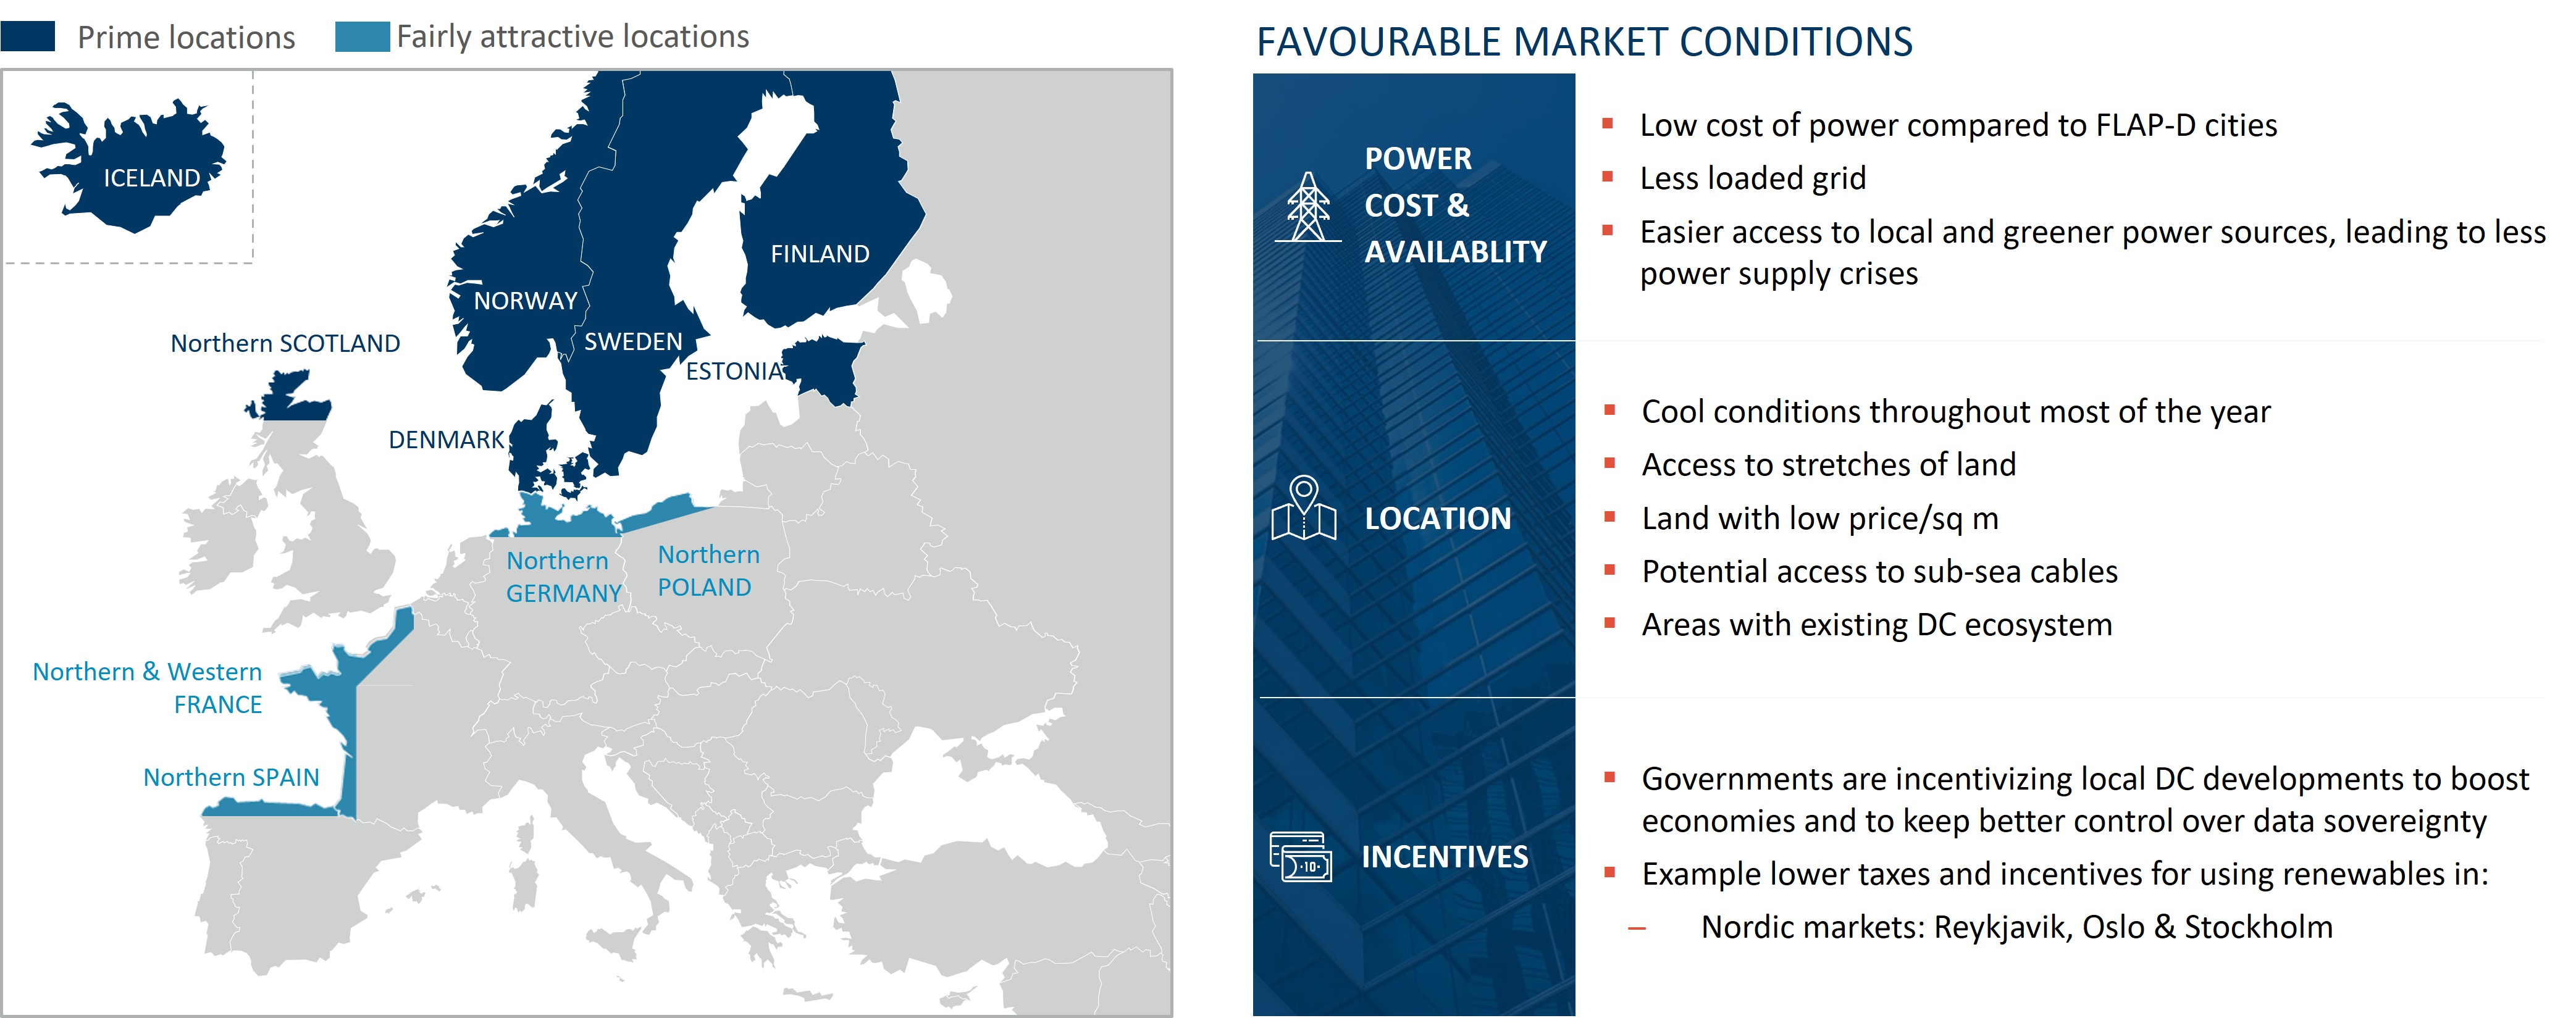
AI is reshaping fibre demand and topology, as ultra-high-capacity fibre and Dense Wavelength Division Multiplexing (“DWDM ”) is enabling large capacity scaling and data-centre growth is extending beyond FLAP-D into Tier II/III markets (notably the Nordics), increasing the need for long-distance, high-capacity interconnection.
Figure 8 – Global Traffic (EB/Month) – FTI Consulting Analysis
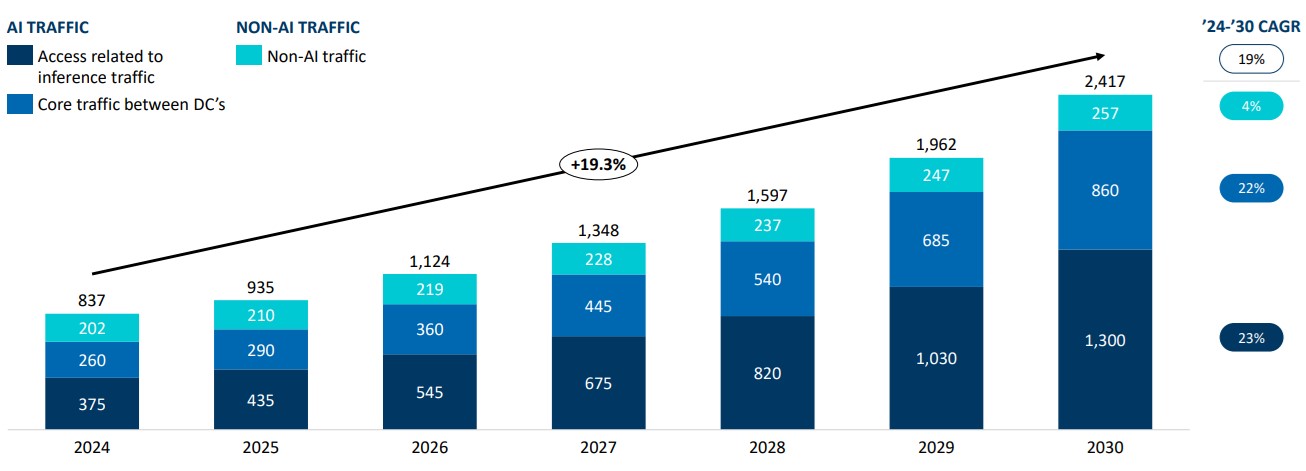
Figure 9 – European AI Data Centres Locations Evaluation
Managed services beyond connectivity
Enterprises increasingly purchase assured performance and operational simplicity, which drives growth in managed networking services that sit on top of physical fibre infrastructure.
The European managed Software-Defined Wide Area Network (“SD-WAN ”) market is projected to grow from approximately $1.4 billion in 2025 to approximately $4.2 billion in 2030, at a CAGR of approximately 25%.22 Service providers with a blended infrastructure and services approach can leverage improved revenue quality, margins and customer retention.
Conclusion: Two Paths, One Capital Logic
As of 2026, European fiber has clearly passed the build-out phase. The creation of value is no longer driven by the expansion of coverage but by the monetization, consolidation and funding of the existing networks.
In FTTH, coverage is largely complete, leaving penetration as the limiting factor on returns. This is driving consolidation of sub-scale operators, the emergence of wholesale-only, multi-ISP platforms and more sophisticated penetration strategies.
In B2B fibre, demand is being reshaped by AI workloads, data centre interconnection and enterprise connectivity, favouring dense metropolitan footprints, high-capacity and low-latency networks and managed services beyond raw connectivity.
Despite these different demand drivers, both segments now follow the same capital logic. Returns accrue to platforms with scale, monetisation discipline, revenue certainty and contracted cash flows. European fibre is no longer about expansion, but infrastructure optimisation and yield improvement.
Footnotes:
1: “FTTH Market Panorama Report by country September 2024,” FTTH Council Europe (June 13, 2024)
2: “FTTH/B Market Panorama 2024,” FTTH Council Europe (March 20, 2024)
3: “Digital Decade 2025: Broadband Coverage in Europe 2024,” European Commission (June 16, 2025)
4: “Guidelines on State aid for broadband networks,” EUR-Lex (March 15, 2023)
5: “Connectivity for a European Gigabit Society – Brochure,” European Commission (September 23, 2019)
6: Supra n. 3
7: “Report on competition amongst multiple operators of NGA networks in the same geographical region,” BEREC (June 8, 2023)
8: “FTTH Market Panorama Report by country September 2024,” FTTH Council Europe (June 13, 2024)
9: Ibid, n. 8
10: Ibid, n. 8
11: “Broadband Investment Guidebook,” World Broadband Association (2024)
12: “European Central Bank interest rates,” Data Portal
13: 2025 Private Equity Value Creation Index, FTI Consulting, 2025
14: Ibid, n. 13
15: Supra n. 8
16: “UK altnets: CityFibre progresses, altnet consolidation set to accelerate,” Enders Analysis (January 22, 2026)
17: Supra n. 11
18: FTI Consulting analysis based on TMT Finance datasets and disclosed deals on (subscription content)
19: Supra n. 15
20: “Investment Tracker – March 2025 Update,” FTTH Council Europe (March 19, 2025)
21: Bauer Verena, “Powerhouse Markets Lead EMEA Data Centre Growth As New Markets Emerge To Reshape Landscape,” Cushman & Wakefield (February 13, 2025)
Related Insights
Related Information
Published
April 27, 2026
 Key Contacts
Senior Managing Director
Managing Director
Senior Director