Beyond Cost Metrics: Recognizing the True Value of Nuclear Energy
-
December 18, 2025
Downloads Download Article
-

Executive Summary
Rising electricity demand, growing reliability pressures and deeper renewable penetration are exposing the limitations of cost-only metrics such as Levelized Cost of Energy (“LCOE”). This paper introduces a value-based framework using two new and complementary measures: Levelized Value of Energy (“LVOE”), which reflects the total value a project can create for its owners, and Levelized Net Benefit (“LNB”), which quantifies the broader value a project can deliver to the overall system. We applied this framework to contrast comparably sized advanced nuclear and solar projects in two separate U.S. power markets - which showed that nuclear, despite a higher LCOE, delivers substantially greater owner and system value. The resulting value difference highlights nuclear’s unpriced contribution to system reliability, fuel savings and long-term cost containment. The findings also challenge the common narrative that nuclear is an expensive option when other, lower-cost solutions are available.1
Grid Pressures Are Driving Renewed Interest in Nuclear
The nuclear energy sector is experiencing a level of momentum that would have seemed improbable just a few years ago. Rapid growth in electricity demand from electrification, digital infrastructure build-out, and industrial re-shoring is intersecting with rising reliability concerns and increasingly severe weather events. These pressures are elevating the importance of firm, clean, long-duration capacity.
In this environment, nuclear is re-emerging through life extensions, restarts and uprates of the existing reactor fleet while advanced reactor developers continue to move through licensing, demonstration and early commercial deployment. Corporate buyers, seeking large scale 24/7 carbon-free electricity, have begun signing long-term agreements for nuclear supply. States are positioning themselves as early hosts for next-generation reactor projects and federal support and financing programs have meaningfully expanded over the last few years. Taken together, these developments reflect a renewed recognition of the growing value of firm, clean resources in meeting future capacity growth and reliability needs, yet our evaluation tools have not kept pace with this shift.
Generation technologies across the industry are typically evaluated using LCOE, a metric developed in an era during which energy was largely interchangeable across hours and seasons. LCOE combines capital costs, operating costs, and energy production into a single dollar-per-megawatt-hour figure.2 It is a simple calculation, familiar and internally consistent as a measure of cost. But it is only a cost metric; it provides no information on the value a resource delivers to the grid.
As renewable penetration has deepened, the economic and reliability value of energy has become far more variable. A firm megawatt-hour delivered during a strained evening peak or a weather-driven emergency has a fundamentally different value than a solar megawatt-hour delivered during midday conditions when supply is abundant.
Today’s planning problem is not simply finding the lowest-cost marginal megawatt-hour but designing portfolios that deliver the required reliability and decarbonization outcomes at the lowest system cost.3 That distinction is at the heart of the nuclear value gap — the difference between the total value that nuclear provides to a system and the amount of value that it can capture through current energy market structures.
The Value Gap: From Cost to System Benefit
LCOE was an effective screening tool when grids were dominated by thermal generation; renewable penetration was modest and intraday variability was limited. In that context, the timing, flexibility and duration of output mattered far less for system cost and reliability than they do today. In the contemporary grid, several structural shifts undermine the usefulness of simple cost-only metrics such as LCOE:
- Temporal value divergence: Energy value now varies sharply by hour and season, and capture prices depend heavily on when a resource generates.
- Adequacy and resilience constraints: More frequent and deeper stress events make firm, multi-day availability increasingly critical for reliability.
- Divergent lifetimes: Nuclear and hydro operate for 60+ years, while solar and wind require multiple reinvestments, creating very different long-term system costs.
FTI Consulting Introduces Two Related Value-Based Metrics: LVOE and LNB
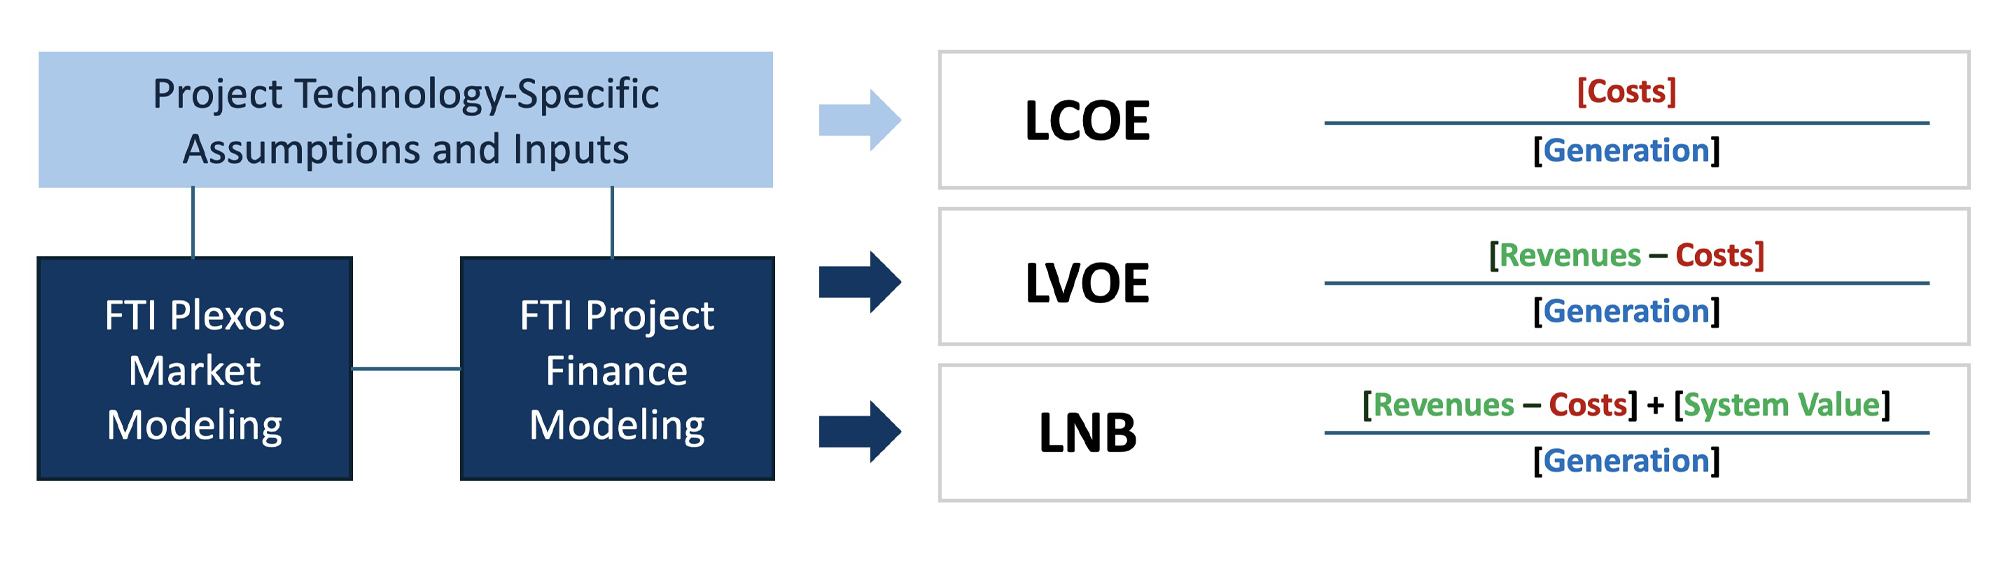
To address these gaps, consider two new metrics: LVOE and LNB. The first metric, LVOE, measures the net economic value a project owner can capture for each megawatt hour (“MWh”) produced over the full life of a plant. Like LCOE, it uses a standard levelizing approach: all future cash flows are discounted to present value and divided by the plant’s discounted lifetime generation.
The key difference between LVOE and LCOE is that LVOE adds revenue instead of totaling costs. It incorporates all monetized value streams a project can earn (energy sales, capacity payments, ancillary services and, where applicable, carbon credits) and subtracts the full set of project costs, including capital expenditures, operations and maintenance costs, fuel, refurbishment cycles and decommissioning. In effect, LVOE is the value-based counterpart to LCOE. While LCOE shows what a resource costs per MWh, LVOE shows the net value a project can realize per MWh under current and future market structures.
The second metric, LNB, measures the discounted net economic benefit of a plant to the system. LNB starts with LVOE and adds quantified system-wide cost reductions not compensated in markets, including avoided investment in additional capacity and avoided system fuel costs. Because retail rates are ultimately driven by total system costs rather than the LCOE of individual resources, LNB provides the metric most linked to long-term rate impacts.
The difference between LNB and LVOE, is the unpriced value. A technology (such as solar) that is fully compensated for the value it delivers will show minimal difference between LVOE and LNB. In contrast, nuclear delivers significant reliability, adequacy, and system cost reductions beyond the compensation it receives.
These types of metrics have not historically been part of standard practice. FTI’s novel approach and modeling capabilities now enable credible, technology-specific valuation of both project revenues and system benefits.
Our Methodology and Modeling Approach
To evaluate nuclear’s value relative to solar on a consistent basis, we combine long-term market modeling with project-level financial analysis. For the market modeling, we use PLEXOS,® a commercial optimization platform widely employed by utilities, system operators and regulators for capacity expansion and production cost modeling.
The PLEXOS® model runs on an internally maintained U.S. zonal dataset that includes updated demand projections, existing fleet characteristics and retirements, technology cost trajectories, fuel price paths, transmission constraints and applicable policy requirements. PLEXOS® produces long-term investment outcomes and hourly dispatch results under reliability and resource constraints.
Technology cost and performance assumptions are drawn from the National Renewable Energy Laboratory Annual Technology Baseline.4
Figure 1: Overview of Our Cost and Value Modeling Approach
The nuclear case reflects a representative 1 gigawatt (“GW”) advanced reactor, modeled with a multi-year construction profile, major refurbishment cycles, and a 60-year operating life. The comparison case is a utility-scale solar portfolio sized to match the nuclear plant’s total 60-year energy production, including full rebuilds in years 20 and 40.
For our comparison, we selected the Electric Reliability Council of Texas (“ERCOT”), the independent system operator for most of Texas, and PJM, a large regional transmission organization spanning multiple Mid-Atlantic and Midwestern states, because ERCOT and PJM represent two of the most important (and contrasting) power market structures in the U.S. ERCOT is a large, energy-only, predominantly merchant market with high renewable penetration, making it a natural test bed for how new firm resources compete on price and system value. PJM, by contrast, combines an energy market with a robust capacity market, operates under tighter regulatory oversight and faces strong decarbonization and reliability pressures alongside growing renewables. These systems are both expected to see sustained long-term electric demand growth, so insights from ERCOT and PJM are especially relevant for future energy generation investment and planning decisions.
All metrics in our comparison are expressed in real dollars using discount rates aligned with the LCOE inputs (6% real for nuclear and 3% real for solar), reflecting differences in financing assumptions and technology risk. We focus on two contrasting regions: ERCOT, an energy-only market with high renewable penetration and weather-driven stress events, and PJM, a capacity-market region with a more diversified resource mix and distinct policy dynamics, using a capacity price assumption of $250/megawatt per day.5
Our analysis proceeds in three steps. First, we use PLEXOS® to generate technology-specific hourly prices, captured energy revenues, curtailment and capacity contributions for each region under decarbonizing system conditions. Second, we combine these outputs with cost profiles in our detailed project finance model to compute discounted cash flows and derive LCOE and LVOE for an illustrative 1 GW plant; although illustrative, the results reflect realistic operational and market outcomes. Third, we calculate system-wide avoided costs (primarily foregone gas peaker capital expenditures and lower system fuel operating expenditures) by comparing scenarios with and without the 1 GW nuclear unit.6 We then convert these avoided costs into a discounted per-MWh value and add that number to LVOE to produce LNB.
To reflect climate policy considerations, we compute carbon value at an illustrative $30/ton carbon dioxide (“CO₂”).7 This represents the avoided emissions benefit of nuclear — valued at $30 for every ton of CO₂ displaced relative to a gas generator in a base case. The results of this modeling framework are summarized below for both ERCOT and PJM.
Results: Comparing Nuclear and Solar Across Cost and Value Metrics
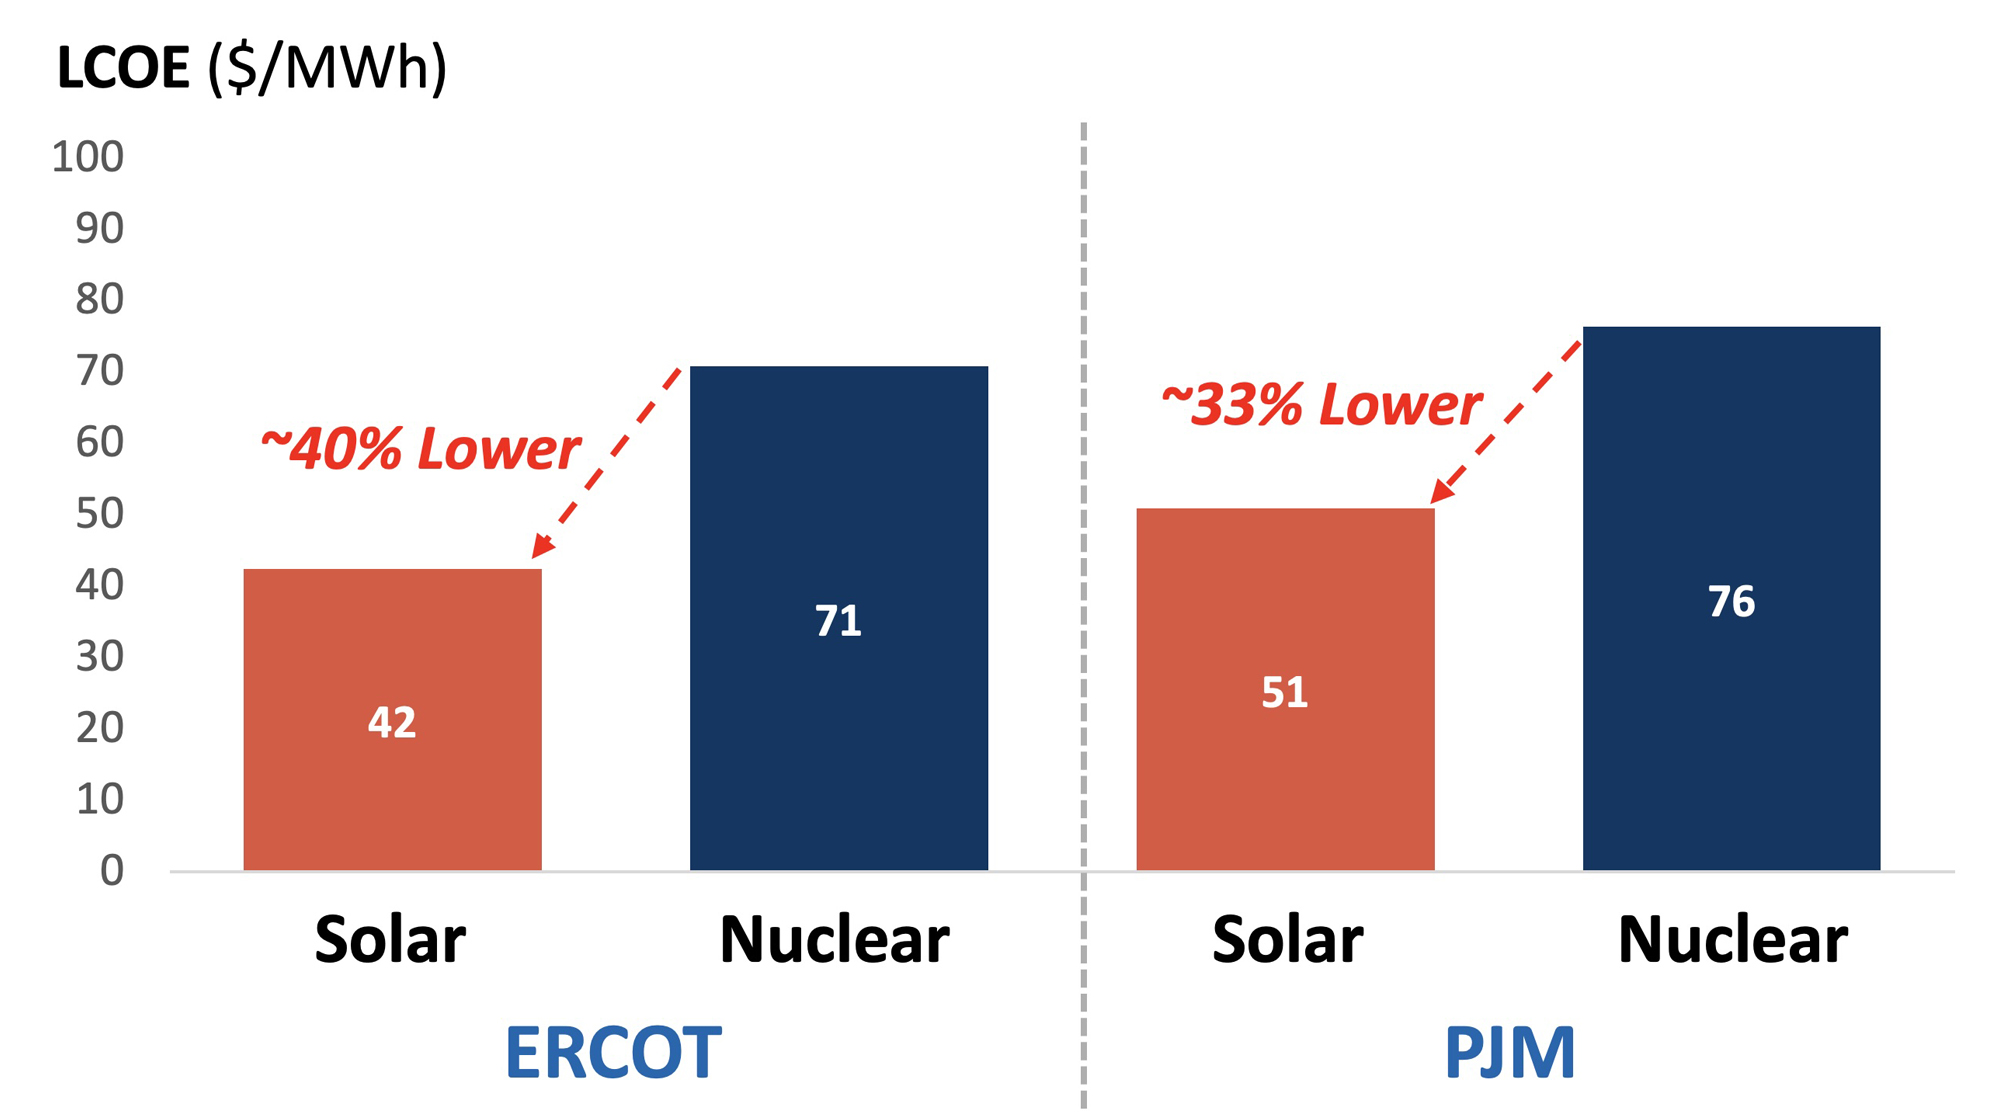
A traditional LCOE comparison produces the expected outcome: solar appears less expensive than nuclear on a cost-per-MWh basis in both ERCOT and PJM. This reflects the lower upfront capital cost of solar, but it does not account for differences in timing, durability or reliability.
Figure 2: Solar and Nuclear LCOE Comparison in ERCOT and PJM8
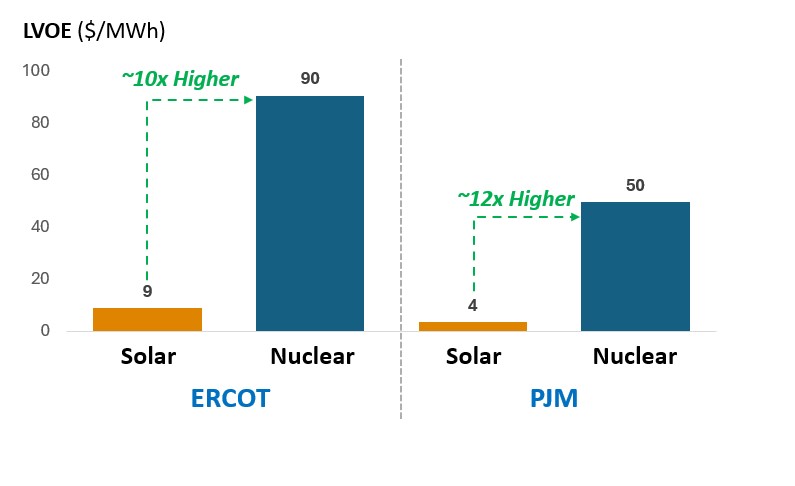
However, once we evaluate monetized net value using LVOE, the comparison shifts. Nuclear generates materially higher owner-level net value per MWh than solar in both regions, driven by its high captured energy value during peak and scarcity times, its firm capacity contribution and its long-lived production profile that avoids multiple reinvestment cycles. The solar LVOE is lower because its captured prices decline with penetration, its effective load carrying capability falls sharply over time and it requires full rebuilds to maintain output over the 60-year period.
Figure 3: Solar and Nuclear LVOE Comparison in ERCOT and PJM9
When we incorporate unpriced system benefits, the divergence becomes even more pronounced. Nuclear reduces the need for additional peaking capacity, lowers system fuel consumption and improves reliability during stressed conditions. These avoided costs materially increase the nuclear LNB. In contrast, the solar LNB is essentially identical to its LVOE because most of its contribution is already monetized in existing market structures, and its integration needs to offset remaining system benefits.
Figure 4: Breakdown of Nuclear Value Components (LVOE to LNB)
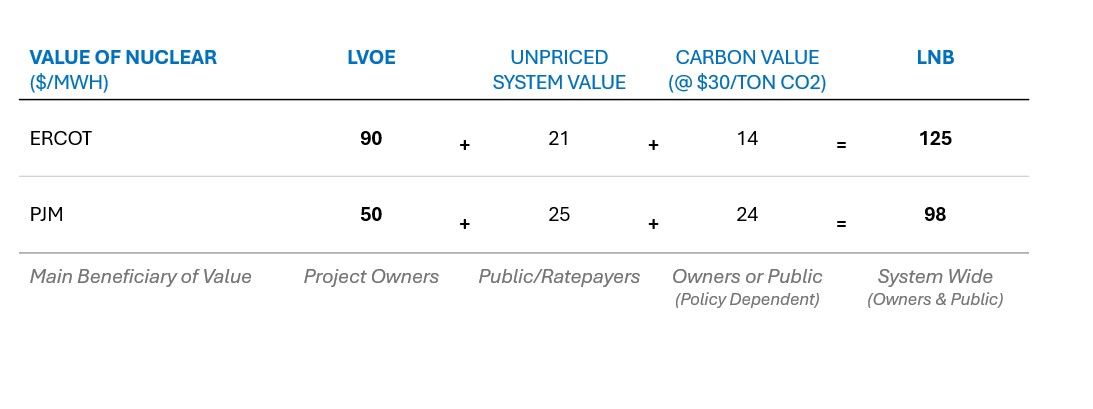
Nuclear LNB combines its monetized project value, unpriced system benefits and carbon value.
The resulting value gap (unpriced system value) captures nuclear’s unpriced contribution to the grid, including long-duration firm capacity, extreme-weather resilience and avoided system expenditures. This gap explains why nuclear can lower long-term system costs even with a higher LCOE, whereas solar’s low LCOE does not automatically translate into lower system costs once firming, storage and integration needs are considered. Put simply: rates follow system cost, not project cost — and nuclear lowers system cost.
Even a modest carbon price further widens this gap, adding meaningful value to nuclear, which can accrue either to the project (through credits) or to the system (through avoided emissions). In Figure 4, the carbon value is included in the LNB figures for simplicity and completeness. Although carbon is not the driver of the results, it reinforces the conclusion: cost-only metrics understate the total value that nuclear provides.
Implications for Developers, Investors, Utilities and Policymakers
This novel LVOE and LNB approach highlight several important implications for stakeholders across the nuclear value chain and broader energy system.
For developers and technology vendors, the findings support commercial strategy and business development efforts by better quantifying the full nuclear value proposition. Demonstrating avoided system costs, resilience benefits and long-lived output enables developers to communicate a clearer, more compelling case to customers and regulators, moving beyond cost-only comparisons toward a value-centered narrative.
For investors and project owners, the analysis provides improved visibility into project economics under realistic market and dispatch conditions. A better understanding of the unpriced system value can inform discussions on commercial structuring, risk allocation and long-term contracting approaches. At a time when investors are starting to express concerns that nuclear could be the next “bubble,” this clarity can help unlock additional capital by aligning project economics with the value nuclear provides to the system.
For utilities and large energy buyers, LVOE and LNB provide clearer visibility into both project-level value and system-level benefits. These metrics help identify how firm, clean resources contribute to overall portfolio performance, reliability and long-term cost trajectories. By understanding the full value delivered by each resource (not just its cost), utilities and buyers can make more informed portfolio choices, balance reliability and decarbonization goals, and avoid future system costs associated with firming, storage and adequacy requirements.
For policymakers and system operators, this approach provides clearer insight into the system value that nuclear can deliver and how it shapes long-term cost trajectories. By quantifying LVOE and LNB, the framework helps inform integrated resource planning efforts, regulatory design and energy policy decisions that recognize resources that reduce future spending on capacity, fuel and integration. This is particularly important today as state governments are increasingly reviewing prior energy policy decisions and their impacts on ratepayers. Incorporating these insights can support more efficient planning, strengthen reliability and ultimately help moderate long-term rate pressures.
In conclusion, these results demonstrate that cost-only comparisons are no longer sufficient — durable, least-cost outcomes emerge only when both monetized and unpriced system value are fully reflected in investment, planning and policy decisions.
How We Can Help:
FTI Consulting’s Power, Renewables & Energy Transition Practice (“PRET”) provides deep market, regulatory, technical and financial expertise to support clients engaged in nuclear development, investment and strategy. Our team includes economists, market modelers, engineers, former utility executives, regulators, journalists, political campaign veterans and financial advisors who understand how cost- and value-based metrics shape nuclear deployment in evolving power markets and the strategies necessary to protect and enhance enterprise value.
We assist clients with advanced nuclear strategy and market entry, long-term market and value forecasting, commercial structuring, stakeholder and regulatory strategy, political risk assessment, federal and state advocacy strategies, transaction support, financial due diligence and project-level financial modeling. PRET also helps clients quantify system value, evaluate portfolio impacts and design financing and contracting structures that reflect nuclear’s full economic contribution. Our integrated approach enables clients to confidently navigate emerging opportunities in firm, clean energy and make decisions aligned with both market realities and long-term system needs.
Footnotes:
1: Gloria Gonzalez and Isa Dominguez, “Nuclear plants are very expensive. Why is Washington obsessed with them?” POLITICO Pro (July 14, 2025) (subs. req’d).
2: “Economics of Nuclear Power,” World Nuclear Association (Sept. 29, 2023).
3: DiGangi, Diana, “LCOE has ‘significant limitations’ and is overused, says CATF,” Utility Dive (June 13, 2025).
4: “Annual Technology Baseline,” NREL (n.d.), Nuclear | Electricity | 2024 | ATB | NREL.
5: In comparison to the current 2025/2026 capacity price of $269/MW-day.
6: We do not include any transmission cost deferrals that would likely also create additional value.
7: Carbon value of $30/ton CO2 is illustrative and based on FTI analysis of historical auction price data from the California Air Resources Board and the Regional Greenhouse Gas Initiative for the last 2 years (Q3 2023 to Q3 2025).
8: FTI analysis of solar and nuclear LCOE in ERCOT and PJM.
9: FTI analysis of solar and nuclear LVOE in ERCOT and PJM.
Related Insights
Related Information
Published
December 18, 2025
 Key Contacts
Managing Director
Director
Global Practice Leader Power, Renewables & Energy Transition (PRET)