GLP-1 Drugs Are Rewriting the Rules of Food and Beverage
-
July 02, 2026
Downloads Download Article
-

When FTI Consulting began tracking the impact of GLP-1 weight-loss medications on consumer food demand in 2025, the central question was whether a pharmaceutical trend could become a structural economic force. One year later, the answer is clear: it already has. Our latest survey, of 1,007 U.S. adults conducted in spring 2026, finds that about 18% of American adults are using a GLP-1 medication, up from approximately 14% in 2025. The 35-54 age cohort leads current adoption (currently using or have used recently) at 23%, and GLP-1 adoption has contributed to consistent reduction in reported obesity rates among U.S. adults for the first time in the 21st century.1
As effectiveness of newer dosage forms continues to build, awareness of these drugs rises further (driven by awareness building campaigns) and lower out of pocket costs drive price elasticity,2 our estimates suggest 1 in 2 eligible adults may adopt a GLP-1 drug over the next 10 year.
Figure 1 - The YoY Trajectory Shows Improved Awareness and Current Usage
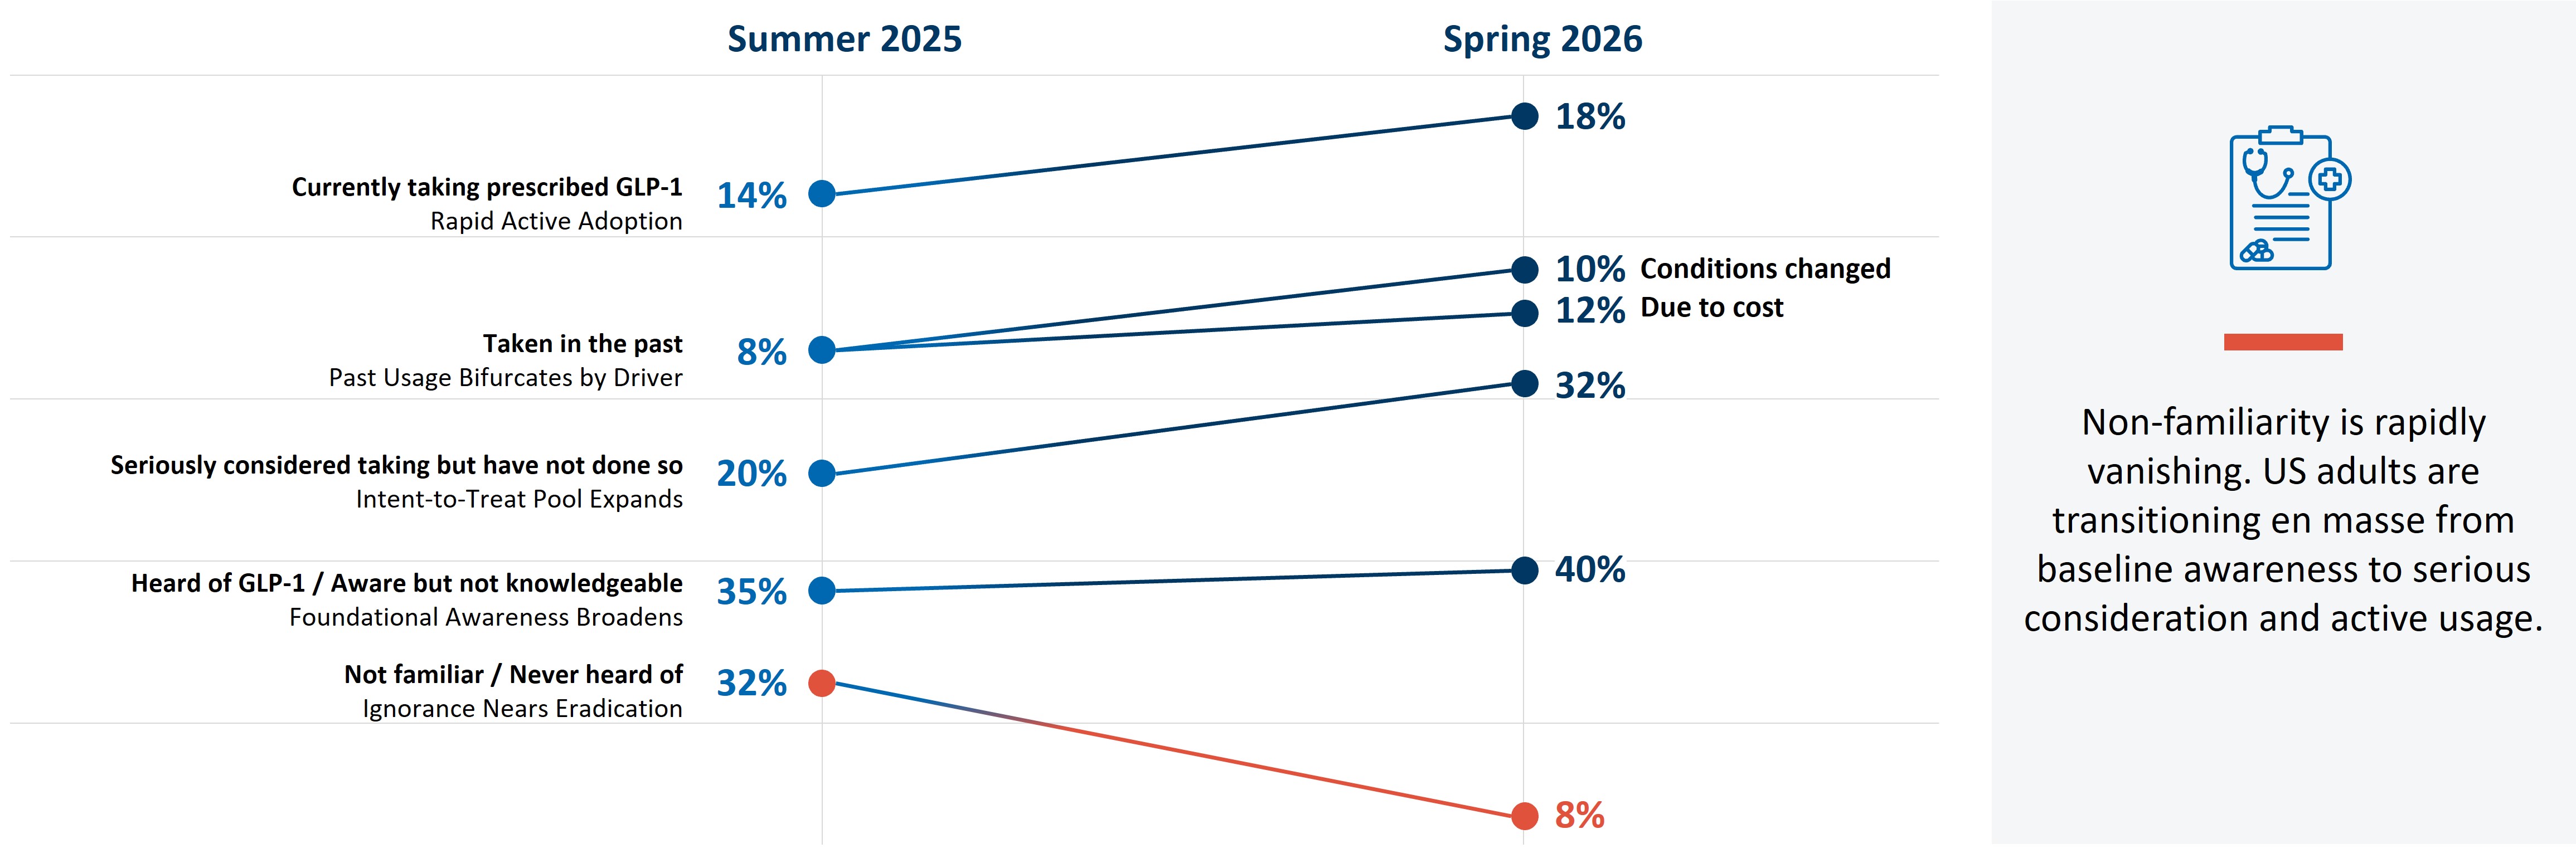
Source: FTI Consulting Survey, March 2026 (n=1,007).
GLP-1 Users: A Different Consumer Cohort
A clear signal in the data is a restructured grocery basket as consumers get on GLP-1 drugs. The volume of chips, sweet bakery goods, cookies, soft drinks, ice cream, candy and chocolate is now substantially lower, with overall spend on these same items tending to stay strong even after starting a GLP-1 regime, suggesting premiumization in consumption.3
Elsewhere in the grocery store, frozen foods show the single largest CPG category impact, with a 3-point drop in dollar spend over year one of active GLP-1 use.4 Non-alcoholic sugary drinks are also contracting, while spending on water filtration and functional beverages is growing, pointing to a mix shift rather than simple volume loss.
The “snackification” trend is migrating. GLP-1 users’ preference for smaller, more frequent eating occasions creates demand for portion-controlled, protein-forward formats. Several manufacturers are already responding with “mini” product versions and GLP-1-friendly labels, particularly in frozen food and dairy. The overall food budget is not shrinking at the same rate as volumes. GLP-1 users are buying less, but trading up: spending is shifting toward fewer, higher-quality, and often more expensive items, which means the opportunity for premium positioning is real even in categories facing headwinds on pure volume.
Figure 2 – Changes in Grocery Spending Six Months Post-GLP-1 Adoption. Savory Snacks, Sweet Bakery and Soft Drinks See the Sharpest Declines; Fresh Produce and Yogurt Show Modest Gains
Source: FTI Consulting Analysis.
Vitamins and Supplements: Where Growth is Moving
Approximately 80% of GLP-1 users consume performance and health nutrition products versus roughly 67% of the general population, with protein shakes, bars and snacks seeing mid-teens consumption increases.5 Protein is the highest-priority category because 20-40% of weight loss on GLP-1 medications comes from lean muscle mass, creating genuine clinical demand alongside behavioral preference.
Figure 3 – GLP-1 Users Over-Index on Every Category
Source: FTI Consulting analysis using Circana, Euromonitor, AlphaWise
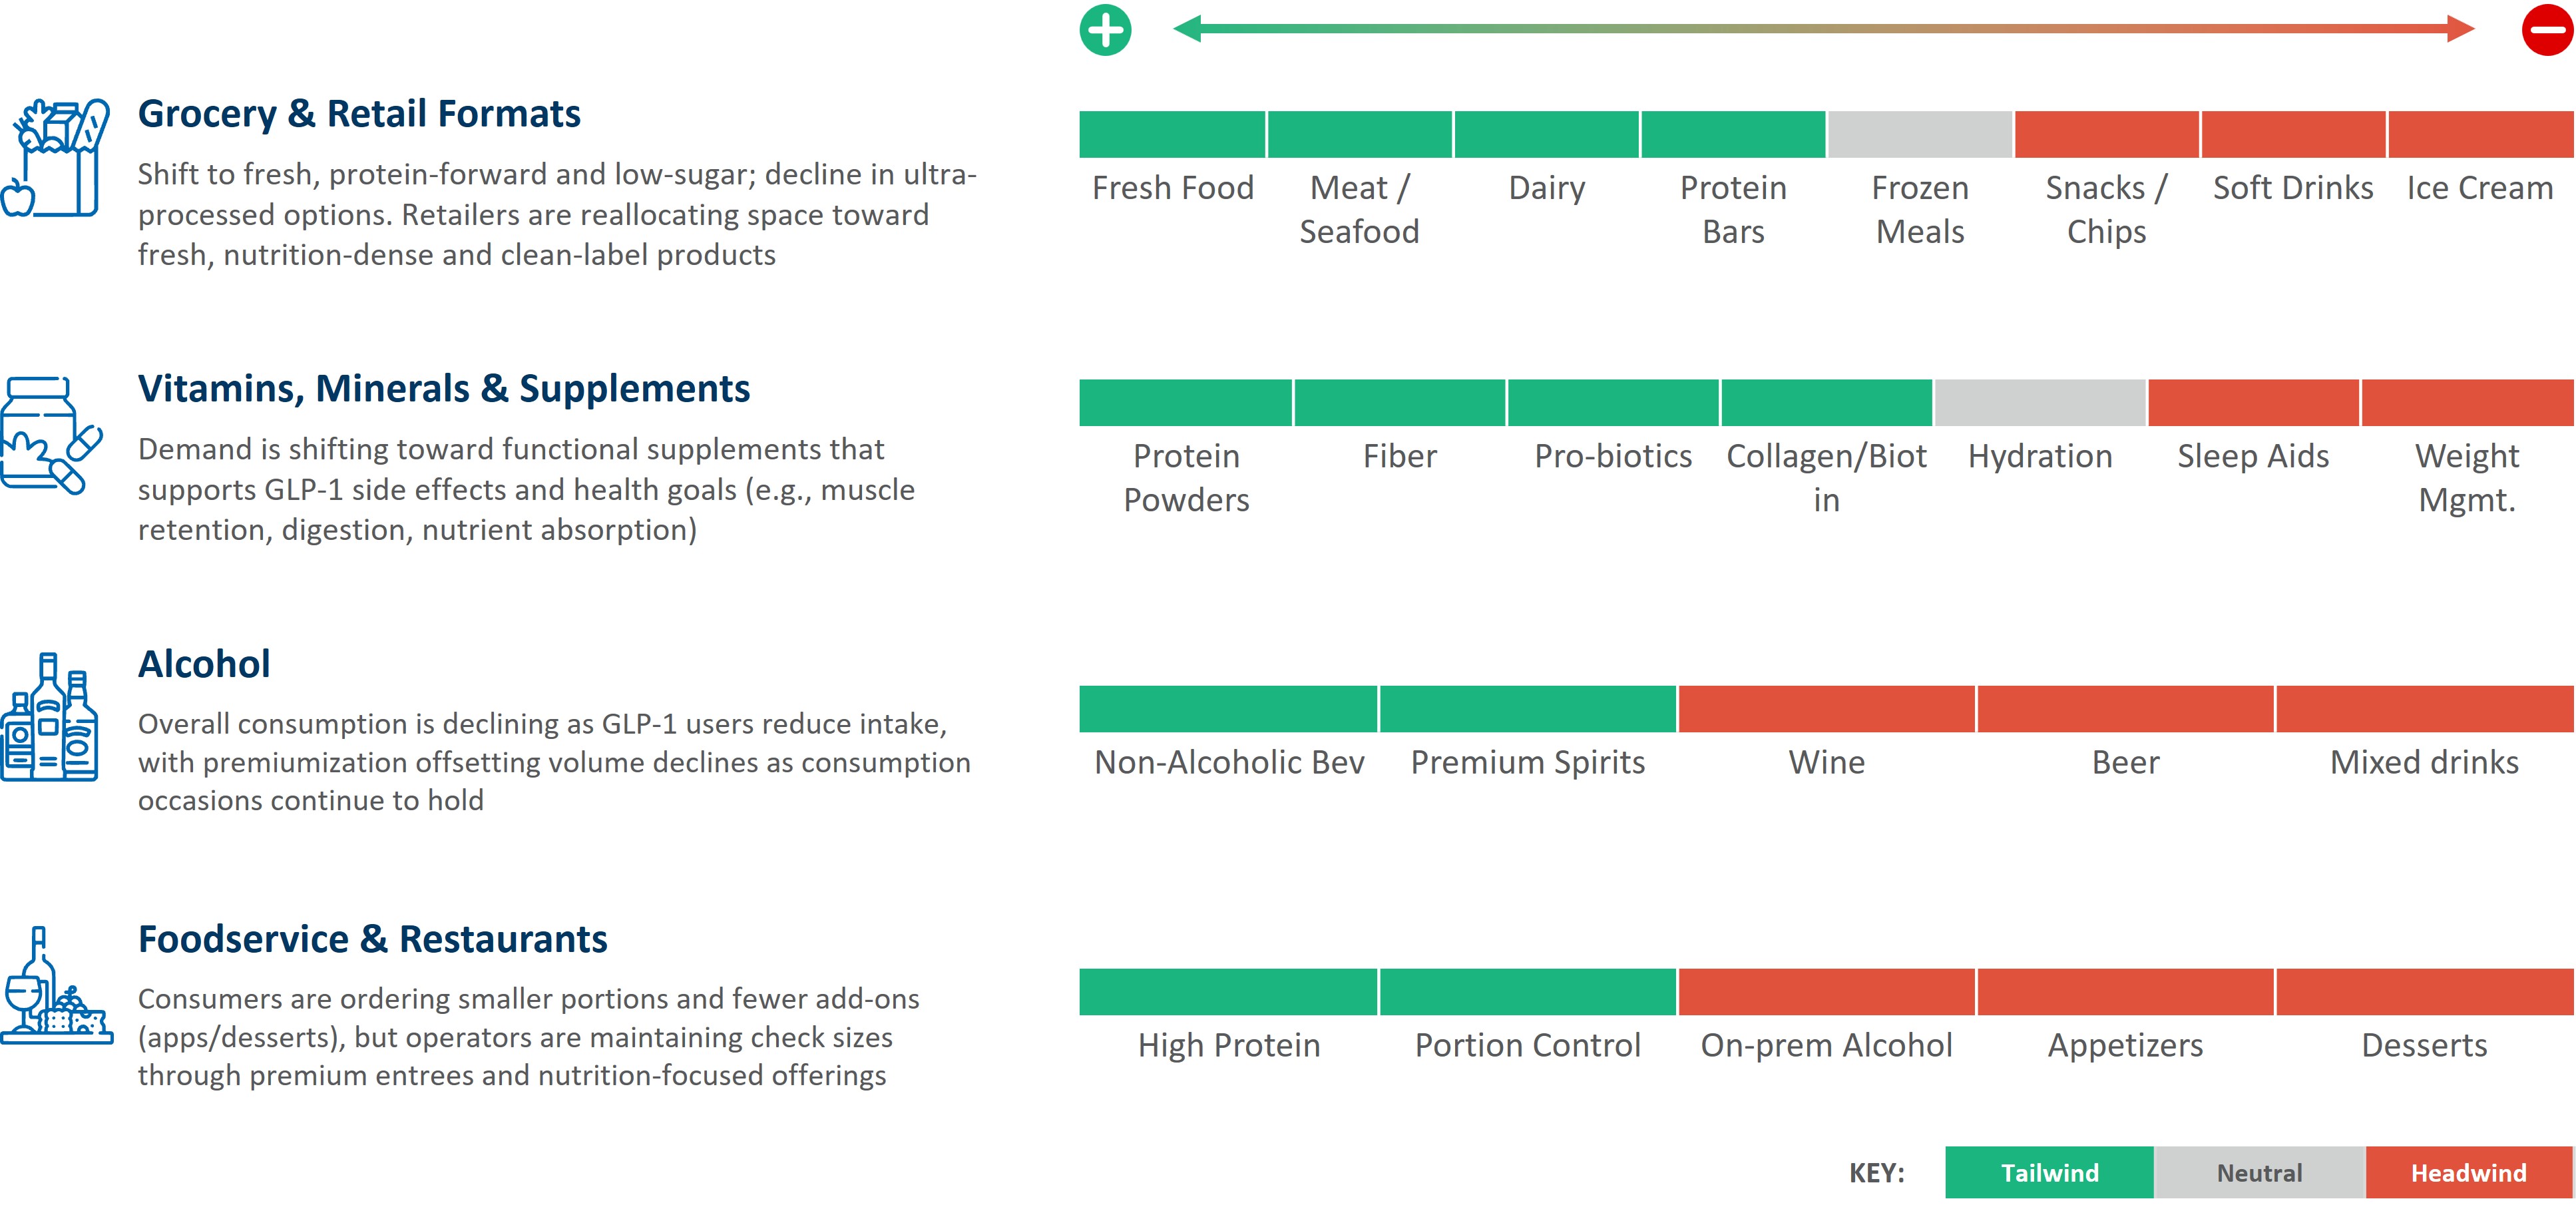
Grocery and Retail: A new layout
The category-level picture inside the grocery store is telling. FTI Consulting’s analysis of year-on-year sales growth data maps out a clear divergence: fresh meat, fish and seafood, yogurt, eggs, produce and vitamins are among the categories most likely to see increased sales, while frozen foods, ice cream, soft drinks, juices, salty snacks, cookies and alcohol sit firmly in the “likelihood to decrease” column. A third group, including gum, chocolate and candy and other checkout-area impulse items, calls for re-merchandising rather than outright contraction. The message for grocery retailers is structural: the store layout that served the pre-GLP-1 consumer is not the one that will serve the next decade’s shopper.
Figure 4 – GLP-1’s Impact on The Grocery Aisle
Source: FTI Consulting analysis
Alcohol and Beverages: Premiumization
Alcohol consumption faces compounding pressure. Around 20% of GLP-1 users report reduced alcohol consumption since starting the medication,6 and FTI Consulting analysis estimates that adoption could cut cumulative U.S. alcohol consumption by approximately 2.5% through 2035.7 Unlike food categories that can be reformulated around protein or fiber, alcohol’s core product is inherently caloric, leaving companies with few levers beyond low- and no-alcohol extensions. Here too, premium spirits and flavor forward mixed drinks tend to maintain their consumption, relative to other spirits and alcoholic beverages (such as hard seltzers). In our survey, 31% to 36% of our cohorts have reported reduced alcohol consumption after starting a GLP-1 regime.
Non-alcoholic drinks rule the roost for current GLP-1 users. However, consumption occasions remain relevant to these users, with respondents indicating that they were more likely to choose premium alcoholic beverages and flavor forward mixed drinks and less likely to pick higher volume drinks such as Beer, Wine and Spirits.
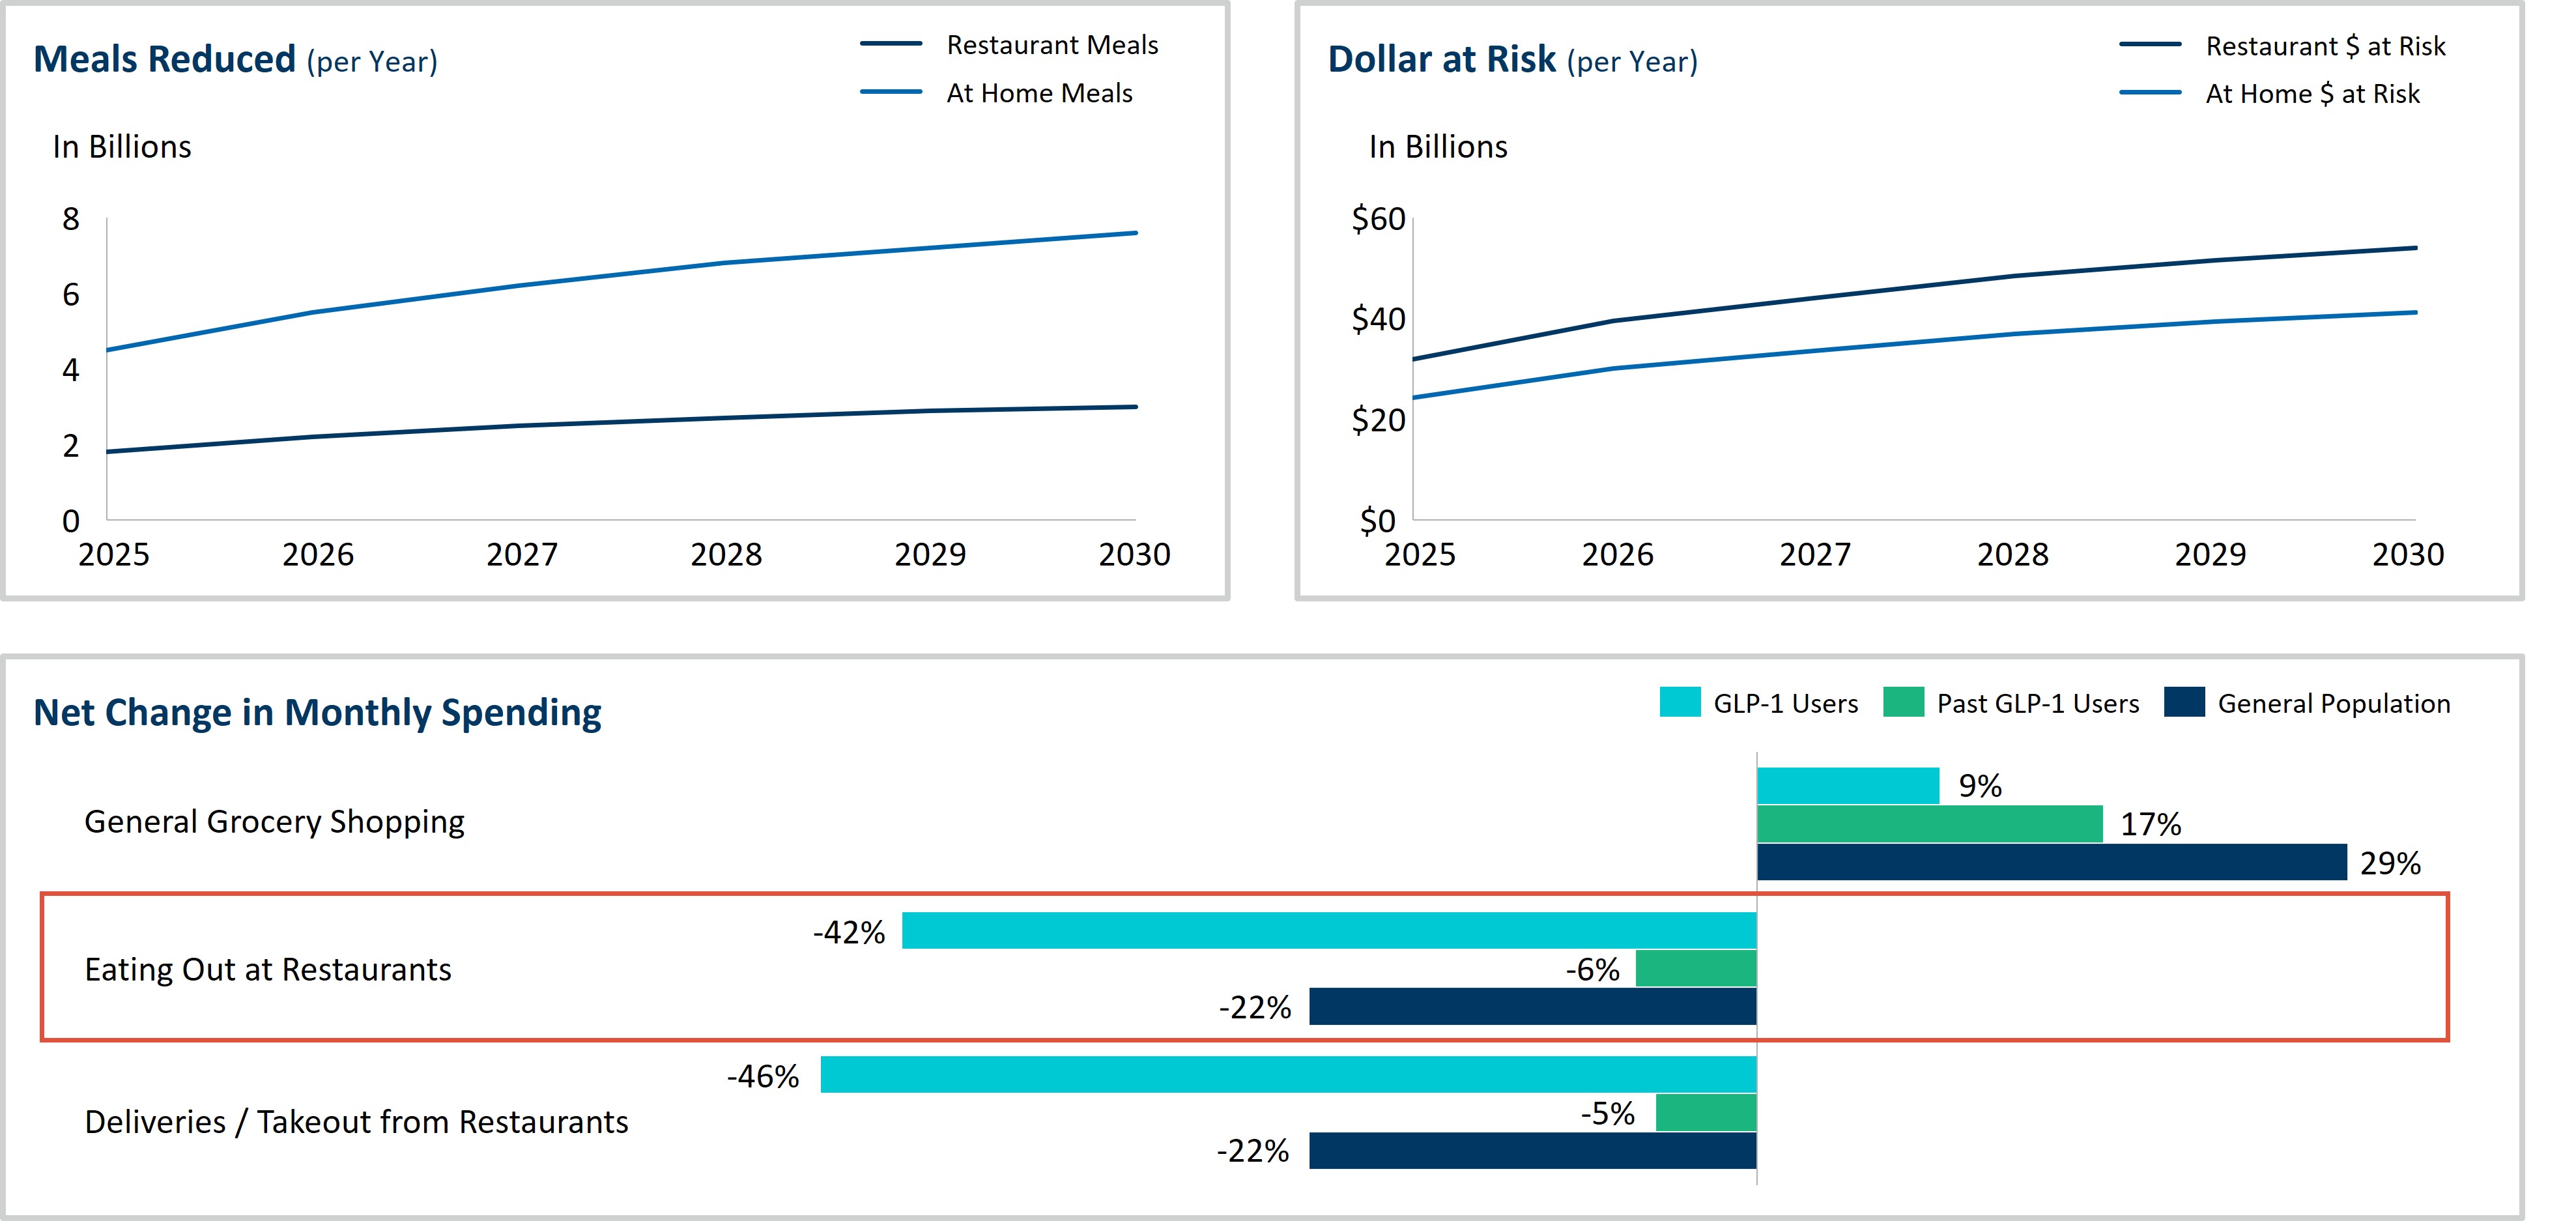
Foodservice and Restaurants: Away From Home Keeps Shrinking
FTI Consulting estimates that GLP-1 adoption will drive approximately 3 billion fewer restaurant equivalent meals per year by 2030, putting roughly $54 billion of restaurant spending at risk.8 Quick service restaurants face the most direct pressure: in high-income zip codes with the highest GLP-1 adoption rates, QSR wallet share declined from 2.86% to 2.38% between 2022 and 2025.9
Full-service and casual dining tell a different story. In those same high-adoption areas, FSR wallet share rose from 7.68% to 9.05%, suggesting GLP-1 users are trading convenience dining for more experiential occasions.⁸ The 35-54 cohort is the key commercial segment here: unlike older users who are broadly cutting back, this group is eating out more (38% report increased frequency), spending more per occasion, and trading up in quality. Any foodservice strategy that does not account for this cohort is working with incomplete information.
Figure 5 - Estimated Cumulative Impact of GLP-1 Adoption on US Packaged Food, Non-Alcoholic Beverage, Alcoholic Beverage, and High-Sugar/Carb Food Sales, 2025E-2030E
Source: GlobalData, Numerator, FTI Consulting Analysis.
How Companies Can Prepare
CEOs, CMOs, and business unit leaders in Consumer Packaged Goods, Restaurant, and Retail must strategically respond on three fronts: portfolio, innovation, and communication. On portfolio, companies should candidly assess which products face structural headwinds and which are positioned to benefit. On innovation, R&D pipelines should be oriented toward muscle preservation, digestive support, and satiety management at lower caloric loads. On communication, GLP-1 users are more intentional label readers than the average consumer — messaging that aligns with their health priorities will build the trust that this cohort responds to.
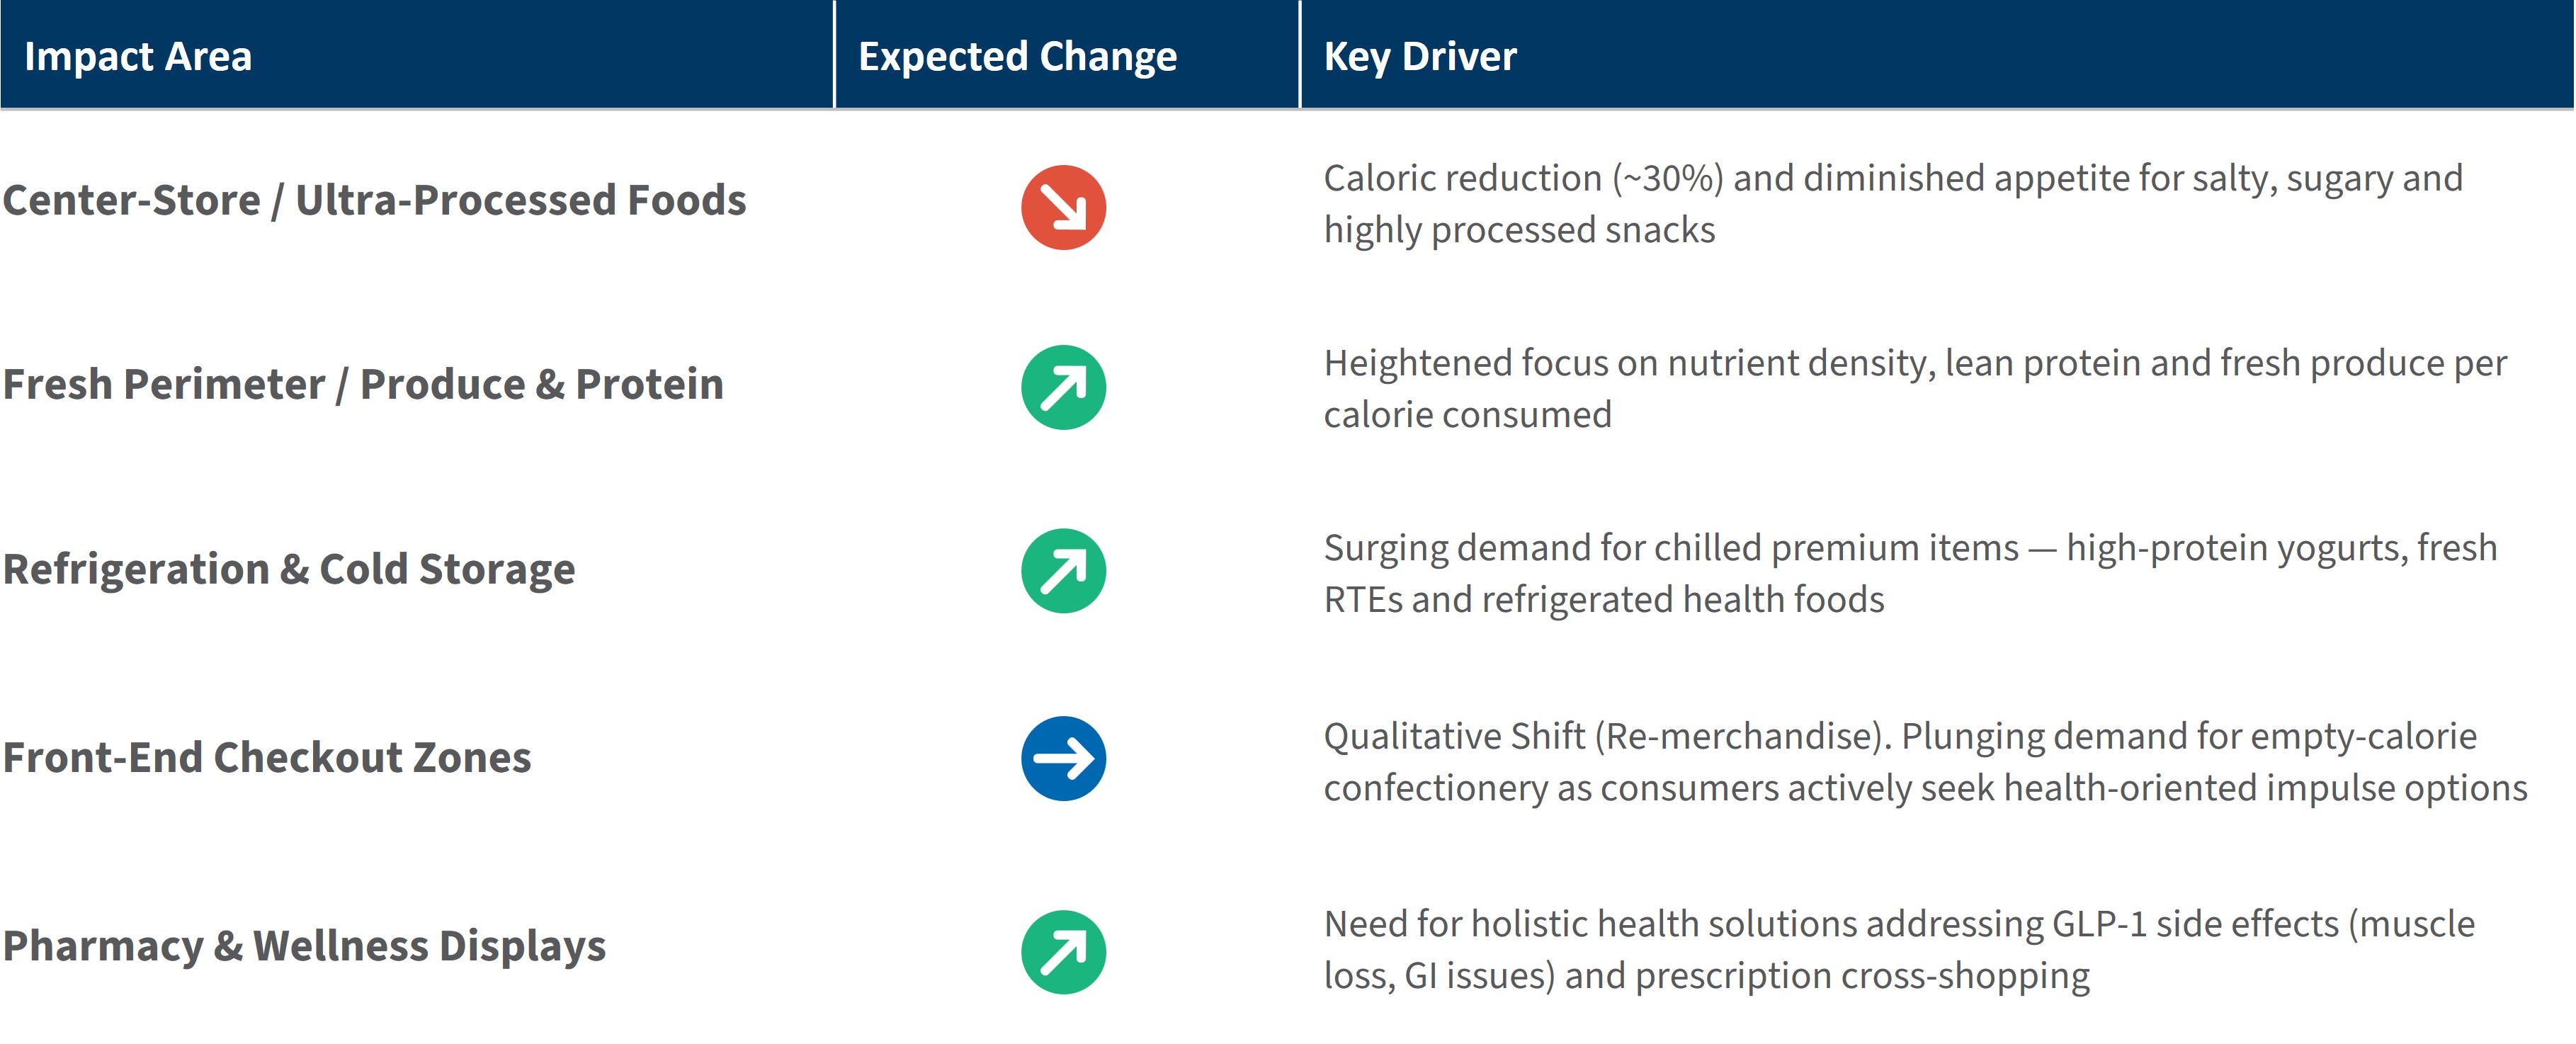
Retailers should also be rethinking store layouts: expanding fresh perimeter space, repositioning checkout zones toward protein and functional hydration formats, and co-merchandising wellness categories adjacent to pharmacy counters.
Conclusion
The numbers leave little room for ambiguity. Approximately $95 billion of packaged food spend and $54 billion of foodservice spend are at risk by 2030 under current adoption trajectories,10 and those figures will only grow as oral formulations arrive and prices continue to fall. Yet the story is not uniformly one of decline. The 35-54 cohort is spending more, dining out more, and actively trading up in quality, making it the single highest-opportunity segment for premium food brands and full-service restaurant concepts precisely as overall category volumes contract.
The window for proactive action is narrowing. Companies that treat GLP-1 as a passing disruption rather than a structural shift in how Americans relate to food are taking a significant strategic risk.
- Portfolio assessment: Identifying where volume pressure is structural and where premium repositioning is viable
- Consumer and market research: Combining proprietary survey data, transaction data and industry expertise to map shifting demand
- Growth strategy: Build a view of categories, formats and consumer segments offering the most definitive path to growth
- Business forecast support: Developing investment and growth plans aligned to the evolution of consumers and core categories
Those that move now, through honest portfolio reviews, nutrition-aligned innovation, and communications that speak to the health-conscious consumer, will be far better positioned for a market that has already begun to change around them.
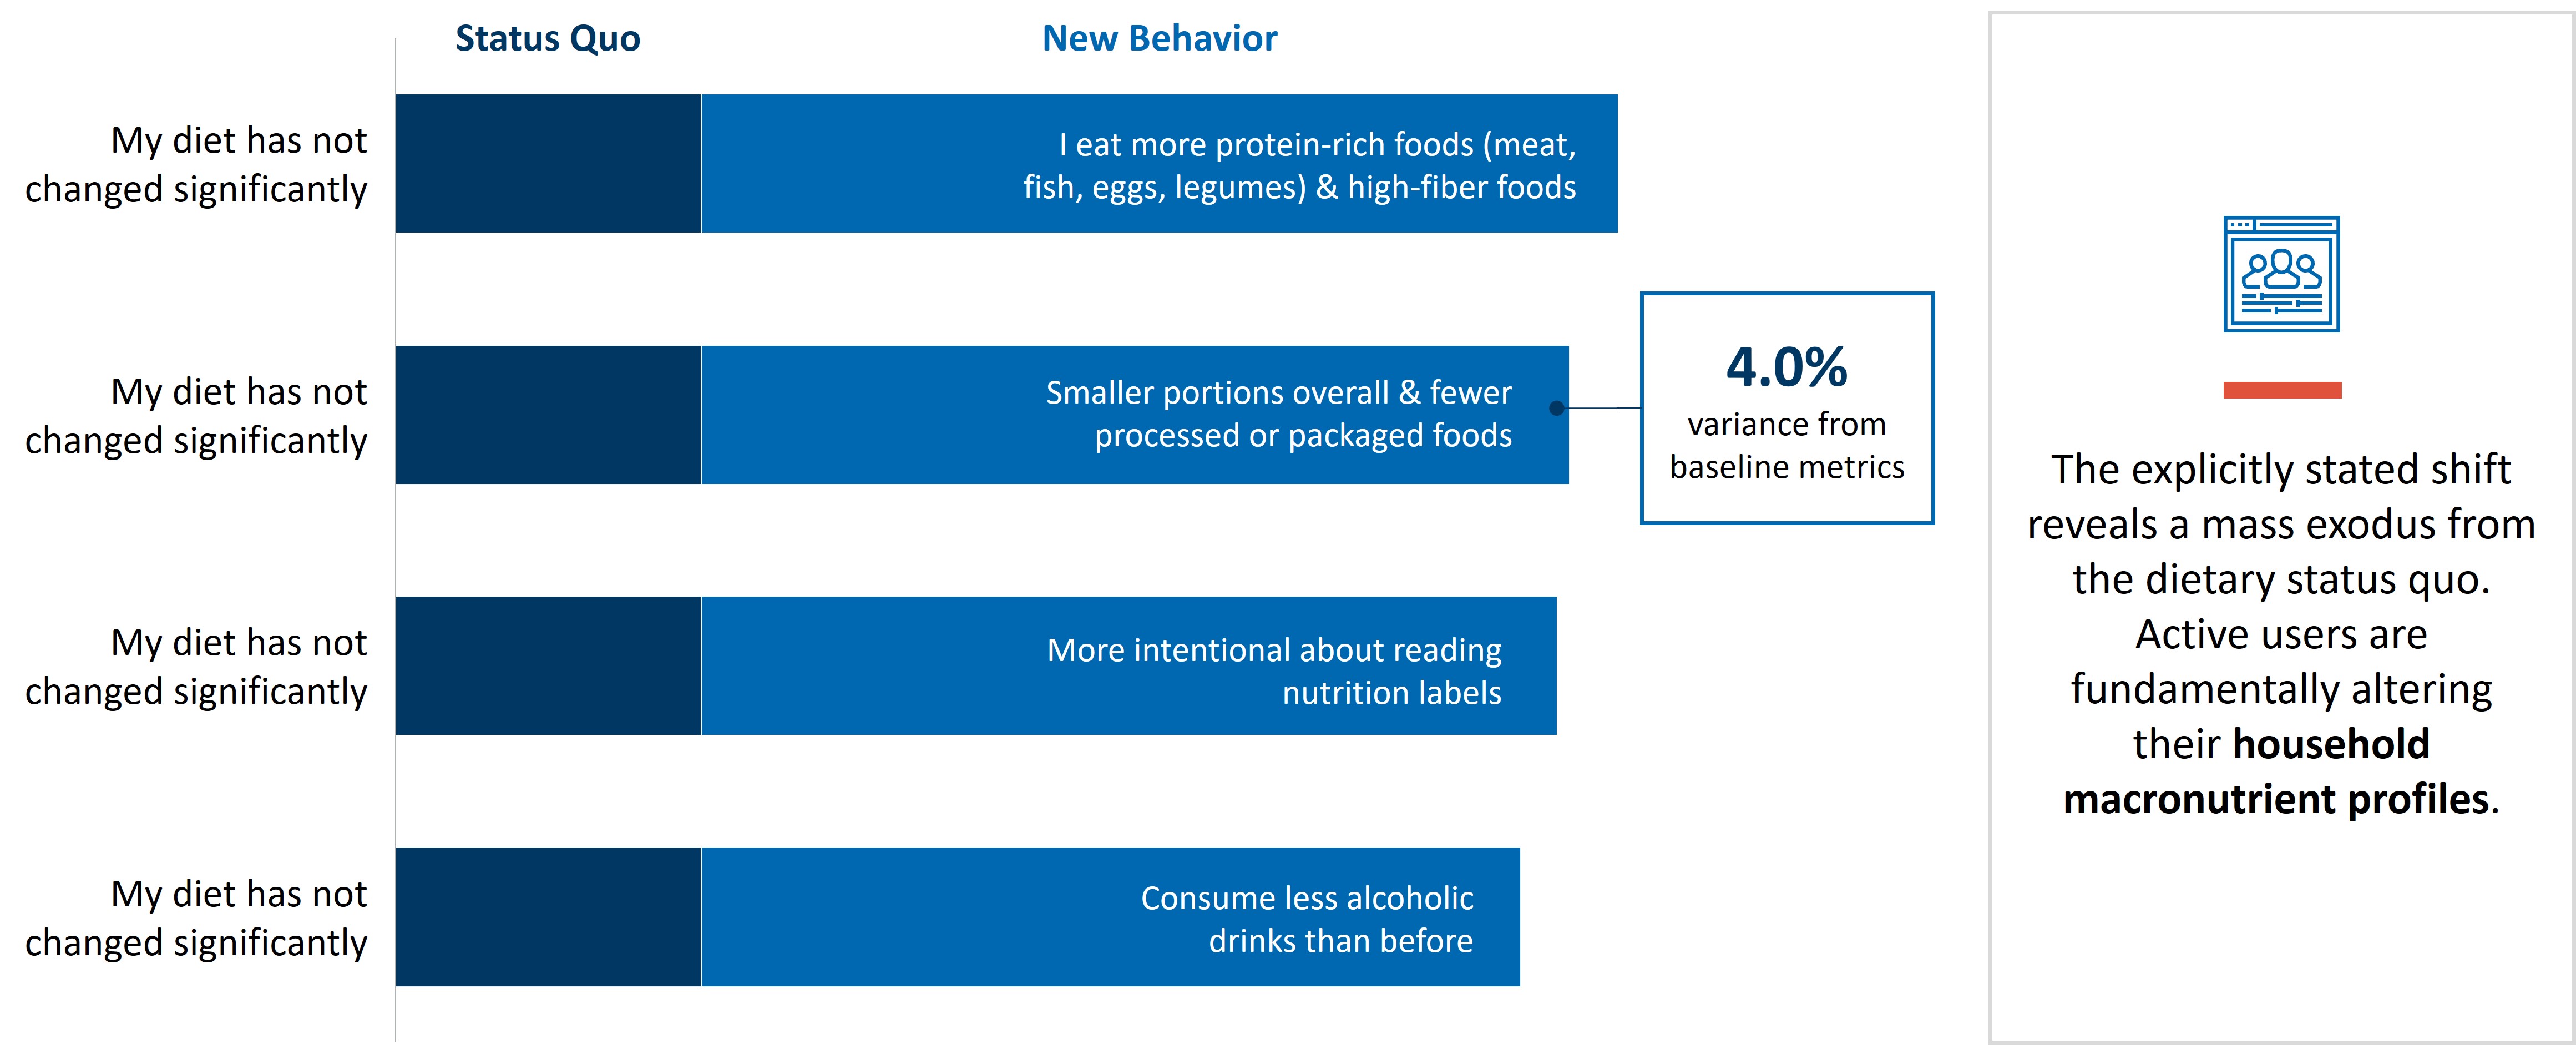
Figure 6 – The Network Effect, Proximity Driving Consideration
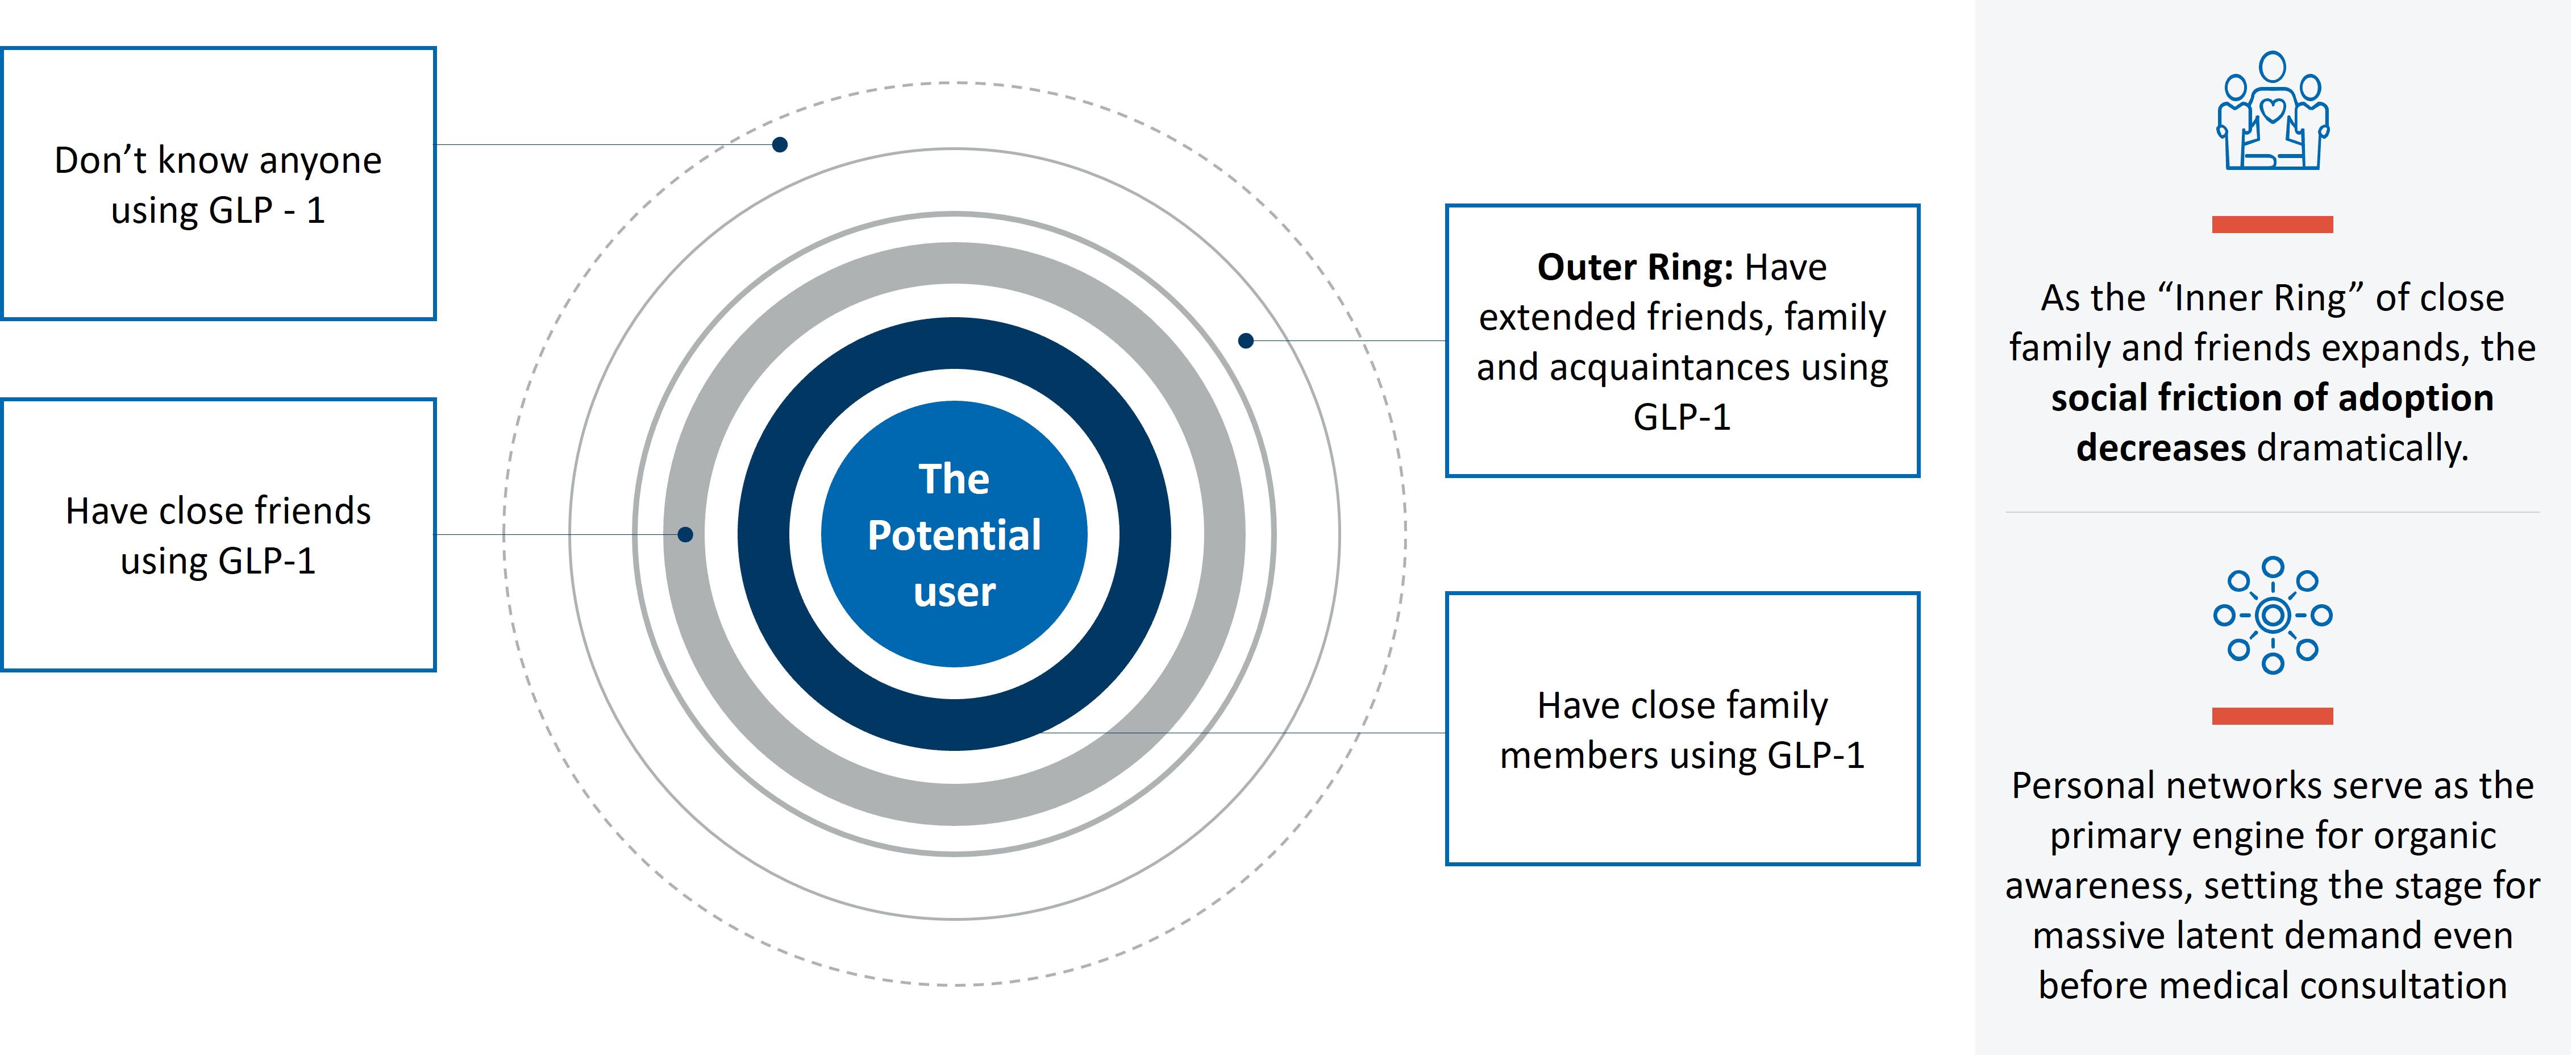
Source: FTI Consulting Analysis
This research is based on a survey of 1,007 US adults, conducted by the FTI Consulting Consumer & Retail team, with results tested at a 95% confidence level and a margin of error of ±3 percentage points.
Footnotes:
1: Dan Witters, Mary Page James, Obesity Rate Declining in U.S., Gallup, October 2025
2: FTI Consulting analysis of publicly-available and licensed subscription data (2026) using Google Trends, Reuters, Business Insider, CNBC, ro, Weightwatchers,
hims&hers, 23andMe, Noom, Digiday, Edo, Fierce Healthcare, Morgan Stanley, KFF, NIH, ICER
3: FTI Consulting analysis of publicly-available and licensed subscription data (2026) using Circana and Earnest Analytics
4: FTI Consulting analysis of publicly-available and licensed subscription data (2026) using Circana Complete Consumer Total US, June 2022-June 2024
5: FTI Consulting analysis of publicly-available and licensed subscription data (2026) using Circana, Euromonitor, Morgan Stanley Research
6: FTI Consulting analysis of publicly-available and licensed subscription data (2026) using Morgan Stantely
7: Supra n.4
8: FTI Consulting analysis of publicly-available and licensed subscription data (2026) using Stephens, Circana, Morgan Stanley Research
9: FTI Consulting analysis of publicly-available and licensed subscription data (2026) using AlphaWise, Census Bureau, Carbon Arc Medical & Pharmacy Open Claims,
Morgan Stanley Research
10: FTI Consulting analysis of publicly-available and licensed subscription data (2026) using GlobalData, Numerator Data, Company Reports, Piper Sandler & Co
Related Insights
Published
July 02, 2026
 Key Contacts
Managing Director