

The More You Sell, The Less You Earn
How Contribution Margin Thinking Becomes a Structural Trap
-
August 10, 2026
-

First. Does your business accept orders, as a matter of policy, whenever the price clears standard variable cost, on the reasoning that any margin above materials and labour beats idle capacity?
Second. Has EBITDA eroded over the past two to three years while revenue held up and the factory stayed busy?
If the answer to both is yes, then what follows will explain why — and why the explanation your management team has most likely reached for is the wrong one.
The Full Factory Illusion
Ask the management of a production company what keeps them up at night and the answers are almost always the same: Will the factory run at capacity? Will the order book cover the cost base? In a world of relentless overhead, a full production hall feels like control, proof that the commercial engine is working and that fixed costs are being absorbed in sufficient volume to deliver profit. But this is the most expensive assumption in industrial management.
Applying contribution margin thinking, which focuses on the profitability of individual units, products or services after subtracting variable costs, as a sustained commercial strategy rather than a short-run tactical rule is just the surface of a deeper structural failure that links the company's accounting, its incentive system and its customer relationships into one self-reinforcing loop. The cost calculation produces an unreliable signal, which compensates a sales force whose actions cannot be directly observed. Those actions tilt the customer mix in a direction the company cannot reverse, because the cost allocation absorbs the consequences and spreads them thinly enough to stay invisible. Because each cycle feeds the next, the damage compounds and the longer it runs, the more it costs to undo.
The financial signature here is consistent: EBITDA erodes despite revenue growth, working capital inflates and management blames input-cost inflation or competitive pressure. Neither is the primary cause. The business is chasing volume to cover a cost base that the volume itself is inflating, on a margin signal that no longer reflects reality. The factory has become a machine that turns effort into loss and the harder it runs, the more it burns.
I. You Are Selling at a Loss and Don’t Know It
The standard contribution margin calculation in most production companies is built on an incomplete cost picture. Some costs meant to be captured directly are not. Production waste is rarely attributed to the order that caused it, and direct labour is costed on normative assumptions rather than actual order-driven variance.
A larger problem sits below the line. The changeover triggered by a short run, the logistics exception for an urgent delivery, the inspection required by one demanding customer and the planning cycle disrupted by a last-minute amendment are all real costs. They vary directly with the orders that cause them, and they are almost never traced to those orders. They are absorbed into negative production results or pooled into overhead, where no one can see what drives them. They behave like variable costs in their causation but like fixed costs in their treatment, so the standard model miscategorises them, and the margin it produces is wrong before any allocation decision is made.
The true cost of a complex order or marginal SKU has three layers, not one. The first layer is the standard variable cost, materials and labour, which the model does capture. The second layer is the hidden variable costs, changeovers, logistics exceptions, custom quality inspections, planning disruption and order administration, which it does not capture. The third layer, and least visible of all, is the overhead the order generates. Every complex order and every marginal SKU expands the overhead pool, which is then spread across the entire business, raising the cost burden on every other customer and product. Simple accounts subsidise complex ones twice. Once through mispriced service and again through an overhead burden that these accounts did nothing to create.
The Logic of the Hidden-Cost Trap
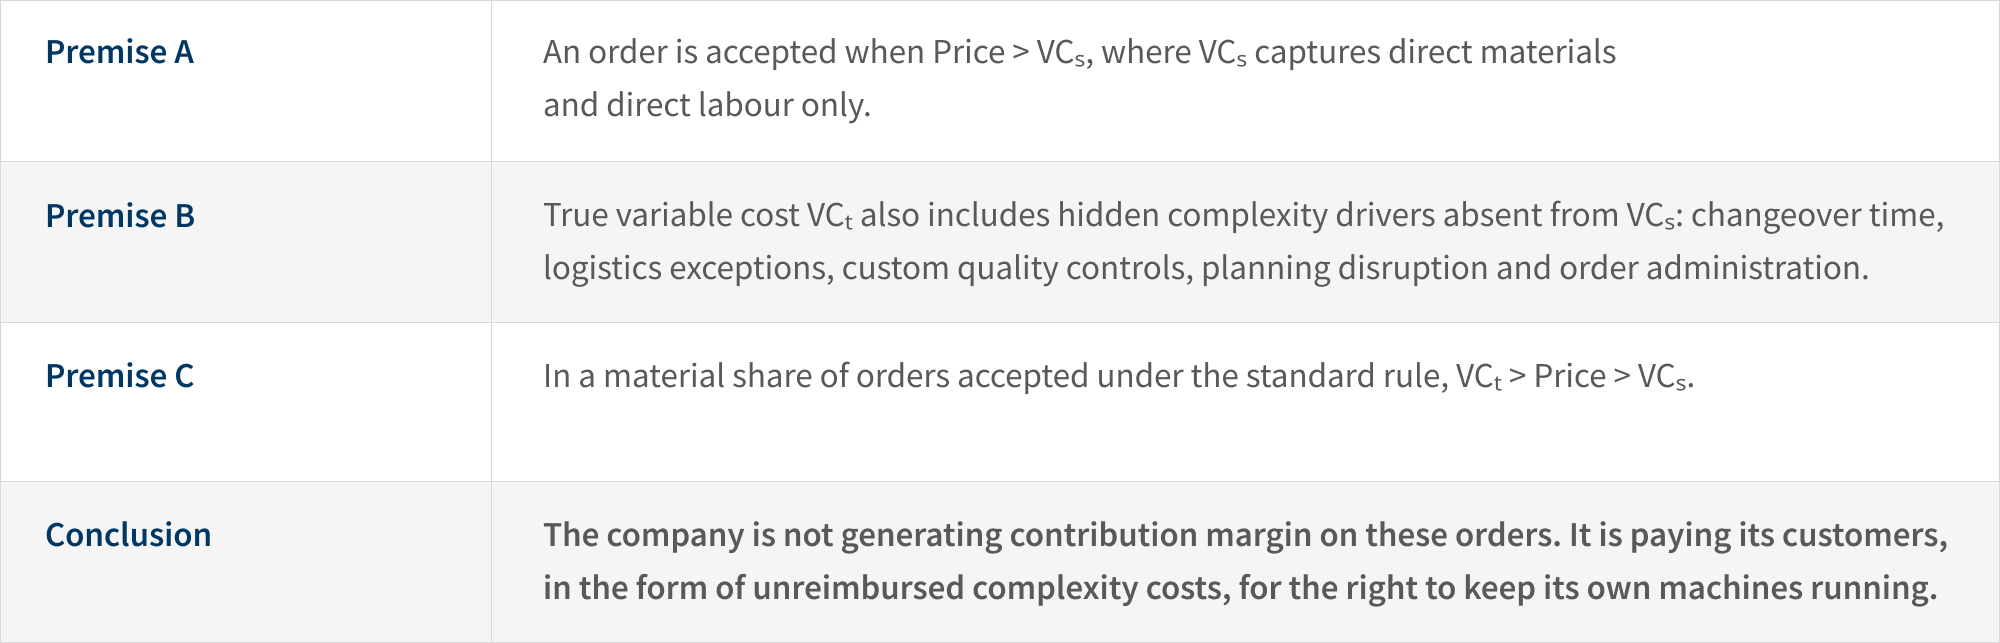
Peanut-Butter Allocation: A Pooling Price By Another Name
The distortion is made worse by allocation. The standard approach bundles indirect costs — logistics, warehousing, quality, planning, customer service, order administration — into a single pool and spreads it across customers as a flat percentage of revenue or machine hours. Every customer carries the same overhead rate. Every order is treated as consuming overhead in proportion to volume. The appeal is simple, cheap and defensible and adequate for the financial reporting it was built for. It only misleads when it is used to price.
A customer taking one consolidated pallet of a single SKU each month does not consume the planning, logistics and service resource of one taking twelve SKUs in irregular quantities with custom labelling and expedited delivery, perhaps five to ten times as much. Both carry the same rate; the first is quietly overcharged, the second quietly subsidised.
Peanut-butter costing is structurally a pooling price. One rate set to the average cost-to-serve of a heterogeneous portfolio. Like any pooling price over a population with material variance, it overcharges the lower tail and undercharges the upper tail. The lower tail responds rationally, by leaving when given the option. It is an active subsidy, paid by the most efficient customers to the most demanding, routed through a pool no one can see into.
The Incentive That Cements the Distortion
On their own, these accounting distortions would already be costly, as they lead a business to accept orders that lose money and to overcharge its most efficient customers. What makes them durable is an incentive system designed, usually without anyone intending it, to keep them in place. Sales performance, and sales compensation in many businesses, is measured on revenue or gross margin. Both are the most available signals, and both fail to respond to the actions that determine economic outcome. A salesperson who accepts a complex, high-maintenance order at a small concession books the same gross margin as one who lands a simple repeat-volume order. The hidden cost of the first decision lands in operations, surfaces months later in the overhead pool, and is redistributed across the portfolio. By the time it is visible at the profit and loss (“P&L”), it has been disconnected from the action that caused it.
In the language of agency theory, gross margin fails the informativeness condition with respect to the action that matters: which orders to accept, which concessions to make, which customers to pursue. Pay on a non-informative signal and the behaviour is predictable, the actions that look best on the measure drift furthest from the ones the company would want.
Operations absorb the consequences with no way to surface them; finance reports overhead inaggregate, so the cross-subsidy never reaches the management accounts. Each function is locally rational; together they make a system in which the company pays its sales force to take actions it would not, on full information, want taken.
II. The Contribution Margin Trap is Self-Reinforcing
The conventional account of contribution margin failure ends here, with the following diagnosis: bad signal, bad incentive and bad outcome. It is incomplete. What makes the trap hard to escape is not the static distortion but the dynamic in which it compounds, contract cycle after contract cycle, until the accumulated customer mix cannot be made profitable at any uniform price. Two loops, running in parallel, drive this.
The Internal Loop: Allocation-Rate Drift
As the order book absorbs more complex orders, the overhead pool grows and finance responds by raising the allocation rate across all customers. The simple, low-complexity customer, who consumed almost none of that overhead, now carries more of it and looks less attractive on a fully-loaded view, though nothing about it has changed. Management attention, pricing focus and investment migrate toward the accounts that look larger on a margin basis. Away from the customers generating value and toward those consuming it.
The External Loop: Self-Selection in The Customer Base
Meanwhile the customer base responds to the resulting prices. Simple customers, whose true cost-to-serve sits well below the blended rate, are overcharged: the price they pay includes overhead they never generated. A rival that prices to their real cost can beat the incumbent and still profit, and with standard needs they switch easily. They leave first. Complex customers, buying their service at a discount to its true cost, stay. In our experience, they tend to negotiate hardest, using volume as leverage. Without cost-to-serve data to anchor the conversation, the business concedes. Each cycle, the lowest-cost-to-serve accounts depart in disproportion, the remaining pool's average cost-to-serve rises, the rate goes up again and the mix rotates further toward complexity.
Why It Does Not Settle
This selection dynamic is the one Akerlof formalised in 1970, and the result is sharper than slow decline: When a single price is set for items whose individual quality cannot be observed, the favourable types withdraw and, beyond a certain dispersion, the market fails to clear at any price.1 That is the precise sense in which late intervention fails. Once the mix has rotated far enough, no uniform price can recover it. It is Gresham's Law applied to customers: At one price, the complex drive out the simple, and every round leaves the portfolio costlier to serve.2
The analogy is not exact, but it holds where it matters: The company's response to raise the rate, hold price and push volume accelerates the next round rather than arresting it. That is why the trap is not symmetric in time. Caught early, it is a repricing problem. Caught late, it requires deliberate, asymmetric repricing with the managed exit of accounts that will not transition, which is far costlier than the same correction made two years earlier.
III. What the Contribution Margin Trap Looks Like in Practice
Few businesses have ever deliberately shaped their customer portfolio against any test of profitability; instead, the portfolio is the accumulated result of years of saying yes, not a design chosen in advance. On a fully-loaded view the order book looks diverse by revenue but is structurally inefficient, and the inefficiency follows a consistent pattern.
A European food manufacturer FTI Consulting worked with provides a good example. From the outside, the business looked healthy, with high utilisation, stable revenue and long-standing customer relationships. On roughly €600 million of revenue, the business had grown for years and treated its large, long-standing relationships as the foundation of the franchise. Reported gross margin was 21% with utilisation above 85%, meaning the order book was growing. EBITDA had eroded from 7.1% to 4.6% over four years, which leadership put down to input-cost inflation and competitive pricing. But a margin-transparency analysis told a different story. A significant share of the customer relationships were loss-making. 40% of the active range was unprofitable, some of it below true variable cost, not through bad pricing but because the cost model had never captured the changeover load, logistics exceptions and planning disruption that those products generated. Once those costs were made visible, contracts were renegotiated and the product tail was cut to deliver a €20 million EBITDA uplift, eliminating loss-making complexity that had been embedded in the model for years.
The Customer Portfolio: Two Dimensions, Four Quadrants
The segmentation is by the two dimensions that drive economic outcome: gross margin (revenue per unit of capacity consumed) on one axis, cost-to-serve (hidden variable cost and overhead consumption) on the other. Every production customer base we have analysed resolves into the same four quadrants.
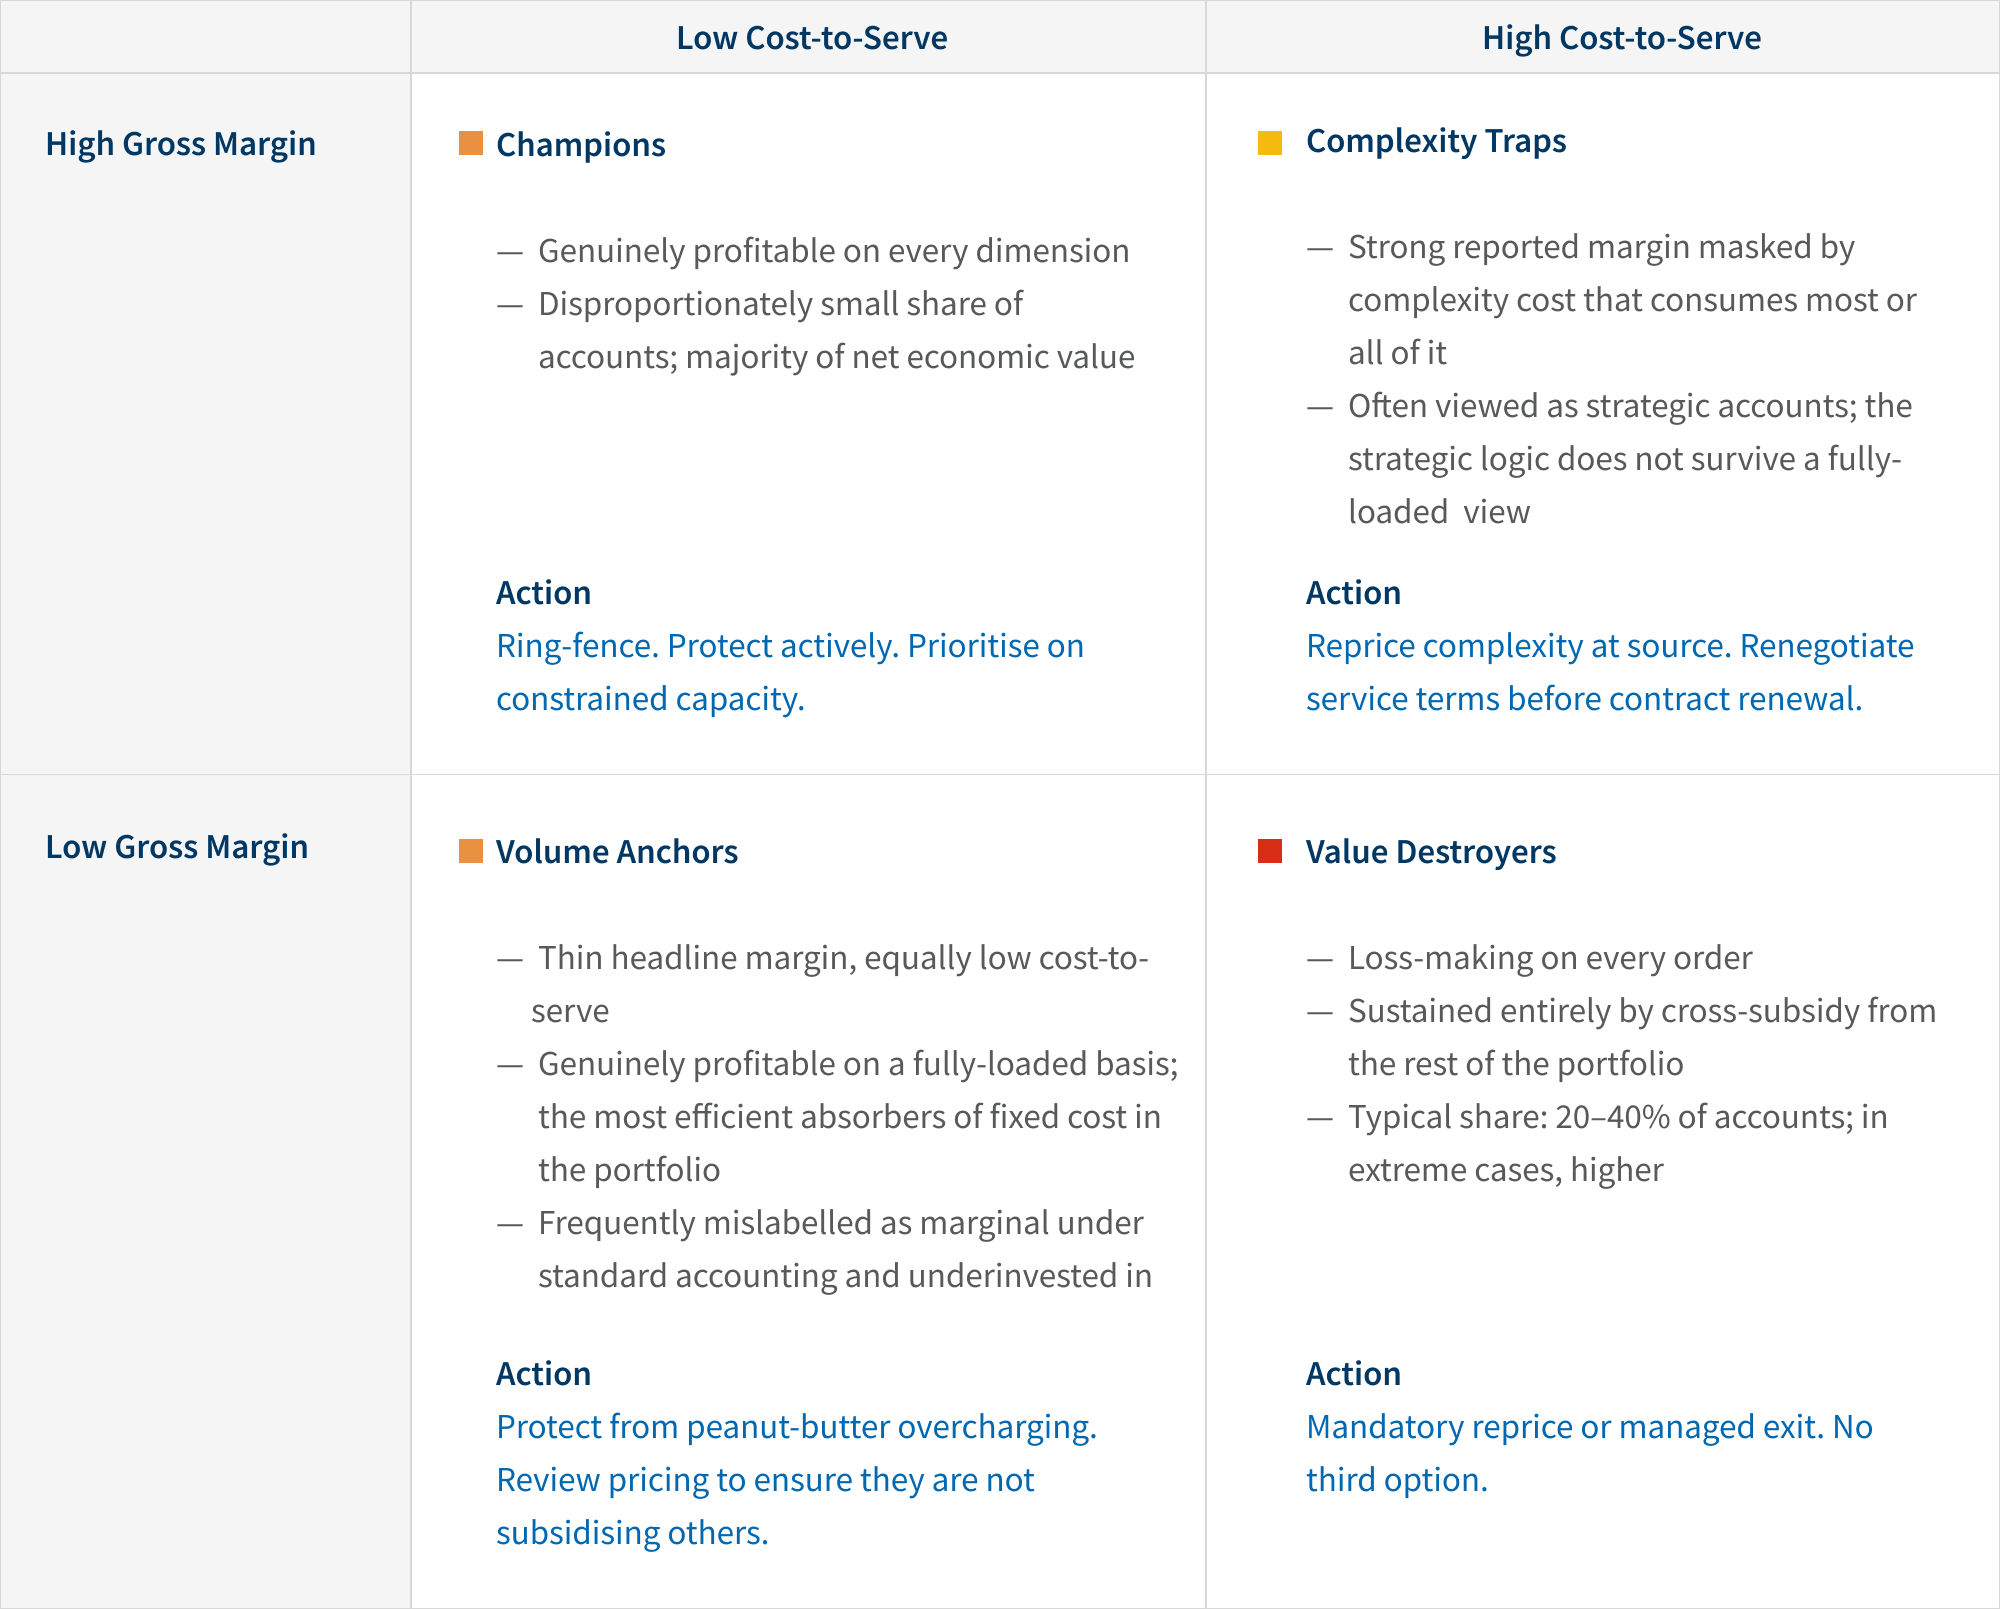
Two observations arise from running this across many cases. The diagonal pairs are the consequential ones: Champions and Value Destroyers run in opposite directions on the P&L, and most of the company's profit depends on their relative size. And Volume Anchors are the segment most consistently misclassified, peanut-butter allocation hits them as hard as anyone, so they surface as candidates for repricing or termination when in fact they are the segment to compete hardest to keep: Profitable once cost to serve is counted so efficiently that losing one reallocates its fixed cost onto everyone else. Their loss rarely sets off an alarm, because the accounts never showed the value they created.
The Product Portfolio
The same plays out in the SKU base, where fifteen to forty percent of active SKUs are typically unprofitable, a subset below true variable cost. They persist because the transparency to find them does not exist: each short run is a changeover, each custom spec a quality check, each extra order line a planning friction. A SKU need not be large to be damaging — only to add complexity exceeding the margin it earns. In the case above, of 1,500 accumulated SKUs, 200 were cut and most of the rest repriced; the overhead pool shrank, working capital was released and the burden on profitable lines fell.
The Working Capital Drag
EBITDA gets the headlines, but the working-capital consequence is at least as material and often more urgent. Aggregate safety stock grows with the number of distinct SKUs: Under demand pooling, one SKU absorbing a given volume needs less inventory than the same volume split across many, and customer-specific specifications break that pooling entirely, since stock held for one customer cannot serve another. SKU proliferation thus imposes a structural inventory cost that scales with complexity, not volume. Add in the work-in-progress cost of shorter runs and a receivables drag and the customers most aggressive on concessions tend to be the most aggressive on payment terms meaning cash does not stop accumulating so much as move to the wrong places.
From Diagnosis to Default
The contribution margin trap reads like a diagnosis — a description of what went wrong in a particular business. That understates it. Invert the question: to design a company that destroyed economic value while looking healthy each quarter, the blueprint would be the one most production businesses already follow. Compensate sales on a measure that ignores the actions that matter. Spread indirect cost evenly so no one can see who consumes what. Steer the factory on utilisation. Accept any order above standard variable cost. Treat range expansion as progress. When margins erode, blame external pressure.
None of the individual decisions appear unreasonable. Each is the default reflex of a competently managed production business. The trap is the natural trajectory of any business that has not deliberately built the counter-mechanisms to resist it. Without active correction, gravity does the rest.
That reframes the question every CEO, CFO, lender and investor should ask. Not whether the trap exists in this business — but why the counter-mechanisms are not already in place.
Footnotes:
1: Akerlof (1970), “The Market for Lemons”. The structural result, that under sufficient asymmetry no clearing price exists, is the closest formal analogue to what we observe in advanced contribution margin trap cases.
2: "Gresham’s law," Encyclopedia Britannica, 7 Dec. 2015.
The views expressed herein are those of the author(s) and not necessarily the views of FTI Consulting, Inc., its management, its subsidiaries, its affiliates, or its other professionals.
Related Insights
Related Information
Published
August 10, 2026
 Key Contacts