Global M&A Q1 2026 Market Update
-
April 29, 2026
-

Executive Summary
The M&A market remains disciplined, with activity reflecting a targeted, strategy-led environment. In the first quarter of 2026, deal volume remained measured, while aggregate value was supported by a limited number of large-scale transactions, signaling that high-value deals, rather than a broad-based increase in activity, continue to drive the market.
Strategic buyers remained the primary drivers of M&A activity, accounting for the majority of global deal volume, while intra-industry transactions continued to dominate.
Global Market Overview
The themes that defined the M&A landscape in the fourth quarter of 2025 carried into the first quarter of 2026. Overall deal volume declined 4.4% quarter-over-quarter and 5.3% year-over-year globally, reinforcing that the market has yet to transition into a broad-based recovery. A disciplined approach to capital deployment remains evident, with strategic buyers accounting for approximately 82.5% of global deal activity. Transactions are driven by corporate priorities rather than sponsor-led volume expansion.
Figure 1 - Disclosed Deal Count by Acquirer Type (#)
(1Q26)
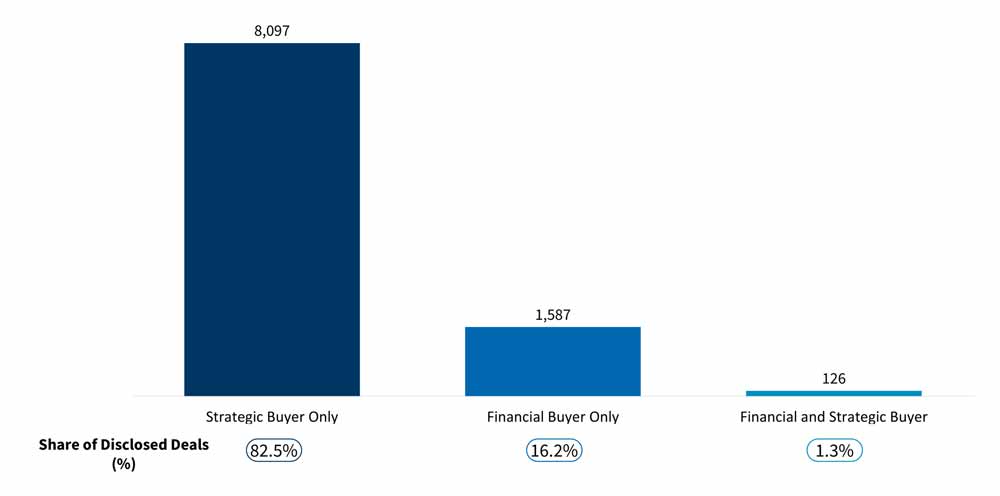
Source: Capital IQ, FTI Consulting analysis
Intra-industry transactions remained the primary driver of deal activity, accounting for 58.6% of global transactions — a slight decline from the prior quarter.
Figure 2 - Share of Deals by Industry-Relation (%)
(1Q24 - 1Q26)
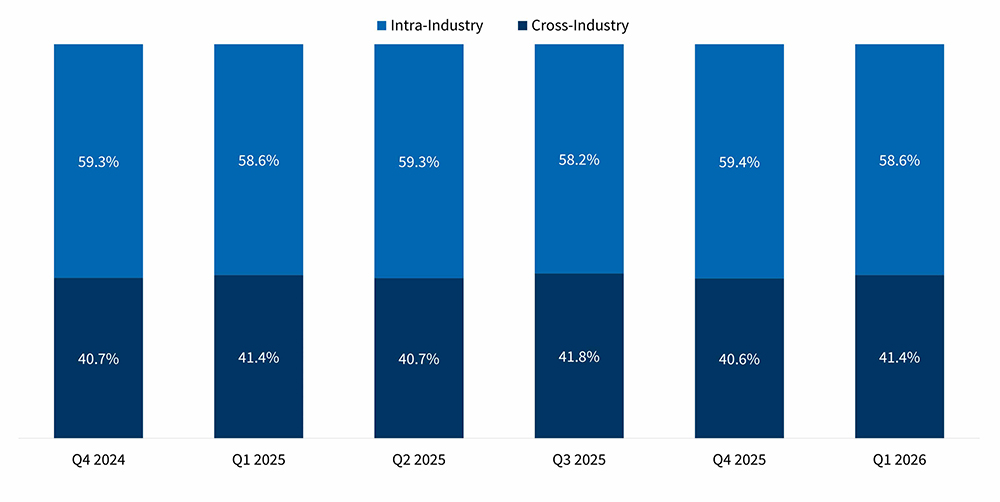
Source: Capital IQ, FTI Consulting analysis
Sector Performance — Volume
Sector-level deal activity in the first quarter of 2026 remained uneven, reflecting varying levels of activity across industries. Deal volume varied across sectors, highlighting that activity remains uneven across industries rather than broad-based. Dealmaking opportunities are increasingly dependent on sector selection rather than overall market momentum, as activity continues to diverge across industries.
Figure 3 - Disclosed Deal Count by Sector (#)
(1Q26)
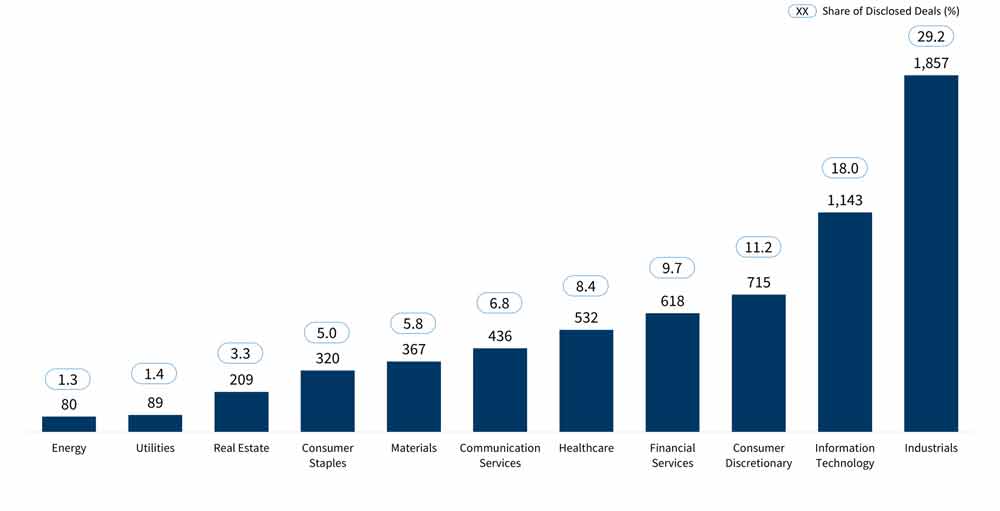
Source: Capital IQ, FTI Consulting analysis
Changes in deal volume on a quarter-over-quarter and year-over-year basis further highlight this variability, with some sectors experiencing growth while others declined.
Figure 4 - Change in Average Disclosed Transaction Value by Sector (%)
(1Q26)
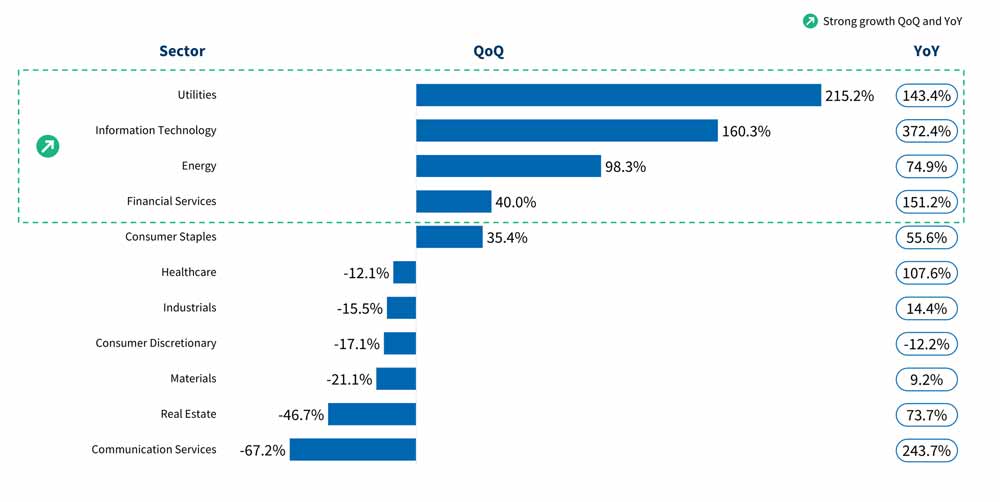
Source: Capital IQ, FTI Consulting analysis
Sector Performance — Value
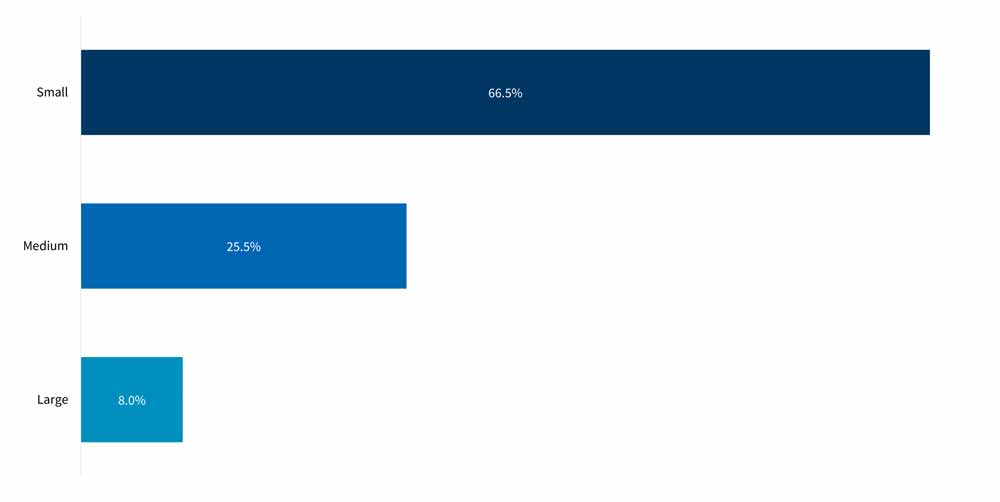
Aggregate deal value in the first quarter of 2026 was driven by a limited number of large transactions, with multiple deals exceeding $10 billion contributing disproportionately to the overall total. While large transactions represent a small share of overall deal volume, they continue to drive a significant portion of total deal value.
Figure 5 - Share of Deals by Transaction Size (%)
(1Q26)
Source: Capital IQ, FTI Consulting analysis
Looking Ahead
As the market progresses through 2026, M&A activity is expected to remain disciplined, with dealmaking driven by strategic priorities rather than a broad-based increase in volume. While large transactions will continue to influence aggregate value, overall activity is likely to remain selective, with sector-specific variability. There is no clear indication of a near-term shift toward broad-based deal activity, reinforcing a market defined by targeted, strategic transactions.
Key themes to monitor include:
- Continued growth in AI-related transactions
- The influence of large-scale transactions on overall deal value
- Potential shifts in financial sponsor participation
- Ongoing divergence in sector-level activity
Definitions:
Domestic transactions are transactions where both the target and buyer are incorporated in the same country. Cross-border transactions are transactions where the target and buyer are incorporated in different countries. Intra-industry transactions are transactions where both the target and buyer operate in the same primary sector. Cross-industry transactions are transactions where the target and buyer operate in different primary sectors. Global transactions are transactions spanning major world regions, including North America, Europe, Asia, Africa, the Middle East, Latin America and the Caribbean. Deal size categories are defined as follows: Small transactions are less than USD 50 million, medium transactions are USD 50 million to less than USD 500 million and large transactions are USD 500 million or greater. AI-related transactions are transactions where the target offers AI-driven products and/or services. Average disclosed transaction value represents total reported deal value divided by the number of transactions with disclosed values for a defined period and sector. Average EV/EBITDA represents the average EV/EBITDA multiple calculated using transactions with disclosed values for a defined period and sector. Cancelled transactions are excluded. Transactions not classified within a specific industry sector are included in overall totals.
Related Insights
Related Information
Published
April 29, 2026
 Key Contacts
Senior Managing Director, Leader of Financial Due Diligence
Senior Managing Director, Global Head of M&A
Senior Managing Director, Leader of Merger Integration & Carve-Outs