Material Uncertainty – ASX Listed Entities 2026
-
June 26, 2026
Downloads Download Article
-

FTI Consulting has analysed all ASX lodgments made from 1 January 2026 to 20 March 2026 for the 31 December 2025 reporting period, examining financial performance for the twelve months to 31 December 2025 of companies reporting a Material Uncertainty.1
For all ASX-listed companies that reported ‘Material Uncertainty’ in their 31 December 2025 financial accounts, total net losses equated to $3.81 billion for the 2025 calendar year (down from $5.04 billion for the 2024 calendar year). While this reduction could be seen as positive, our analysis shows other measures for this cohort are less positive. We therefore advocate multi-factor assessment of corporate health, with Material Uncertainty disclosure as a key flag for further diligence analysis.
ASX listed companies are required to report their statutory accounts for the financial year ending 30 June and half year ending 31 December with the ASX.2 In preparing these reports, directors and management must consider the company’s financial position and whether the going concern basis of preparation remains appropriate. If there are events or conditions that cast significant doubt on a company’s ability to continue as a going concern, a Material Uncertainty exists,3 and this will require disclosure in the financial statements. In turn, the auditors are required to assess and conclude, based on the evidence obtained, whether a Material Uncertainty exists with respect to events or conditions that may cast significant doubt on the entity’s ability to continue as a going concern.4
The inclusion of a Material Uncertainty qualification suggests a company may be facing significant stress or requires a refinance or capital raise and may, in some cases, foreshadow an insolvency event.5
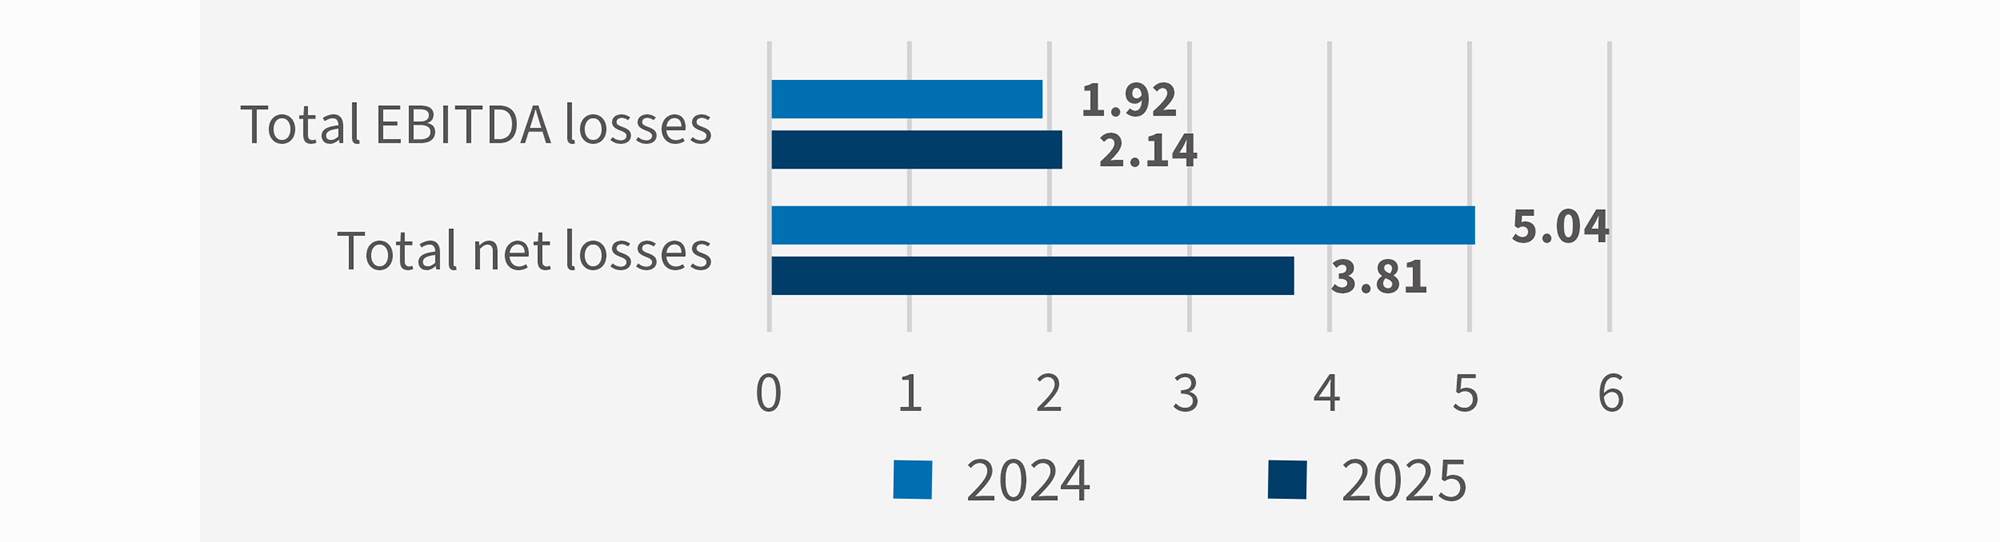
Figure 1 – Headline Losses
For the calendar year ended 31 December 2025, ASX-listed companies disclosing a Material Uncertainty reported:
- total EBITDA losses of $2.14 billion (up from $1.92 billion for 2024); and
- total net losses of $3.81 billion (down from $5.04 billion in 2024) – this improvement was driven by a 61% reduction in total depreciation and amortisation expense from $1.13 billion in 2024 to $0.44 billion in 2025. Total net interest expense remained relatively flat, increasing 7% to $0.40 billion ($0.38 billion million for 2024).
23% of companies listed on the ASX reported ‘a Material Uncertainty’ in their half yearly filings between 1 January 2026 and 20 March 2026 (up from 22% in 2025). Consistent with our previous findings for the calendar year 2024, Western Australia is disproportionately represented with 51% of the companies reporting a Material Uncertainty.6 [Figure 2]
In our experience, this is consistent with the relatively high number of companies within the Western Australia listed resources sector that are often pre-revenue and reliant on successive equity capital raisings to continue as a going concern, as they build value through the exploration to development cycle.
Figure 2 – MU by State
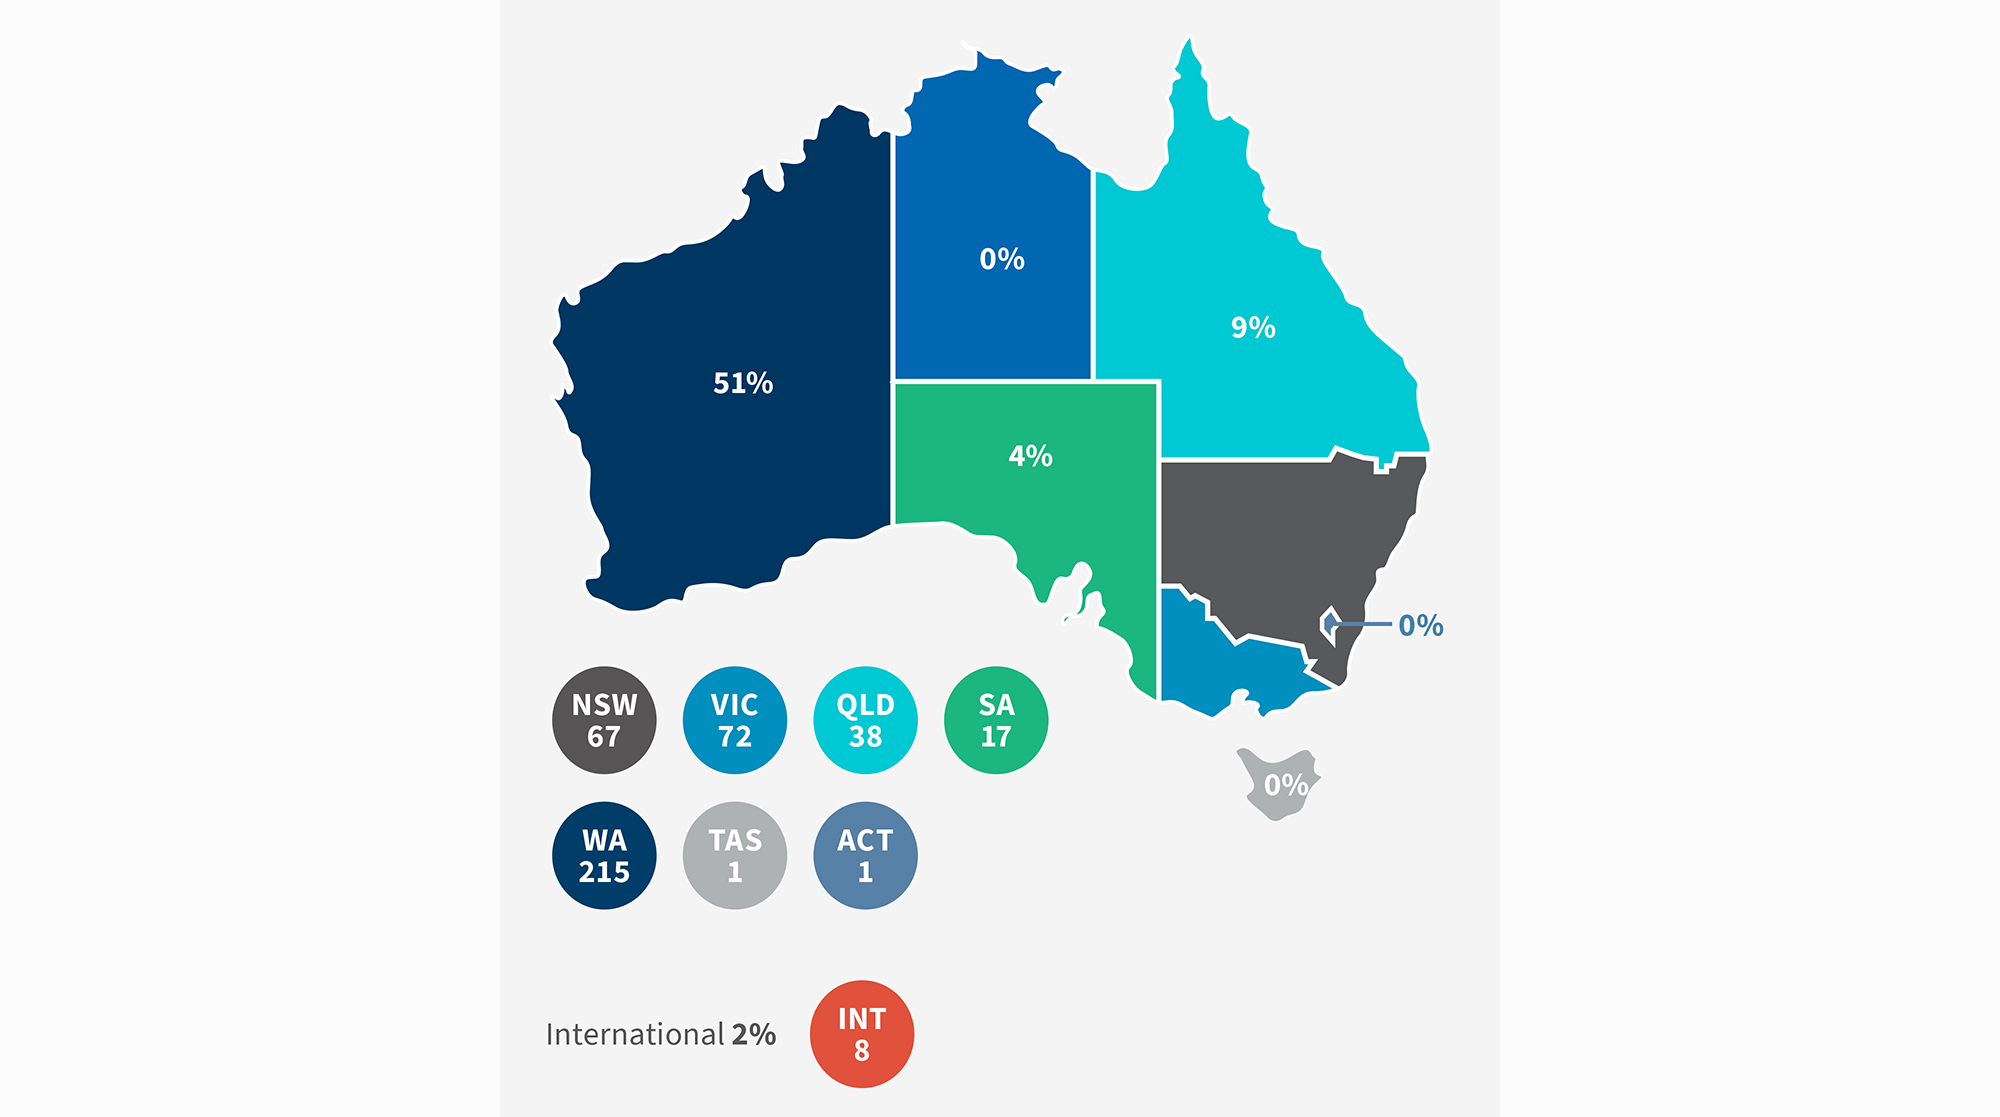
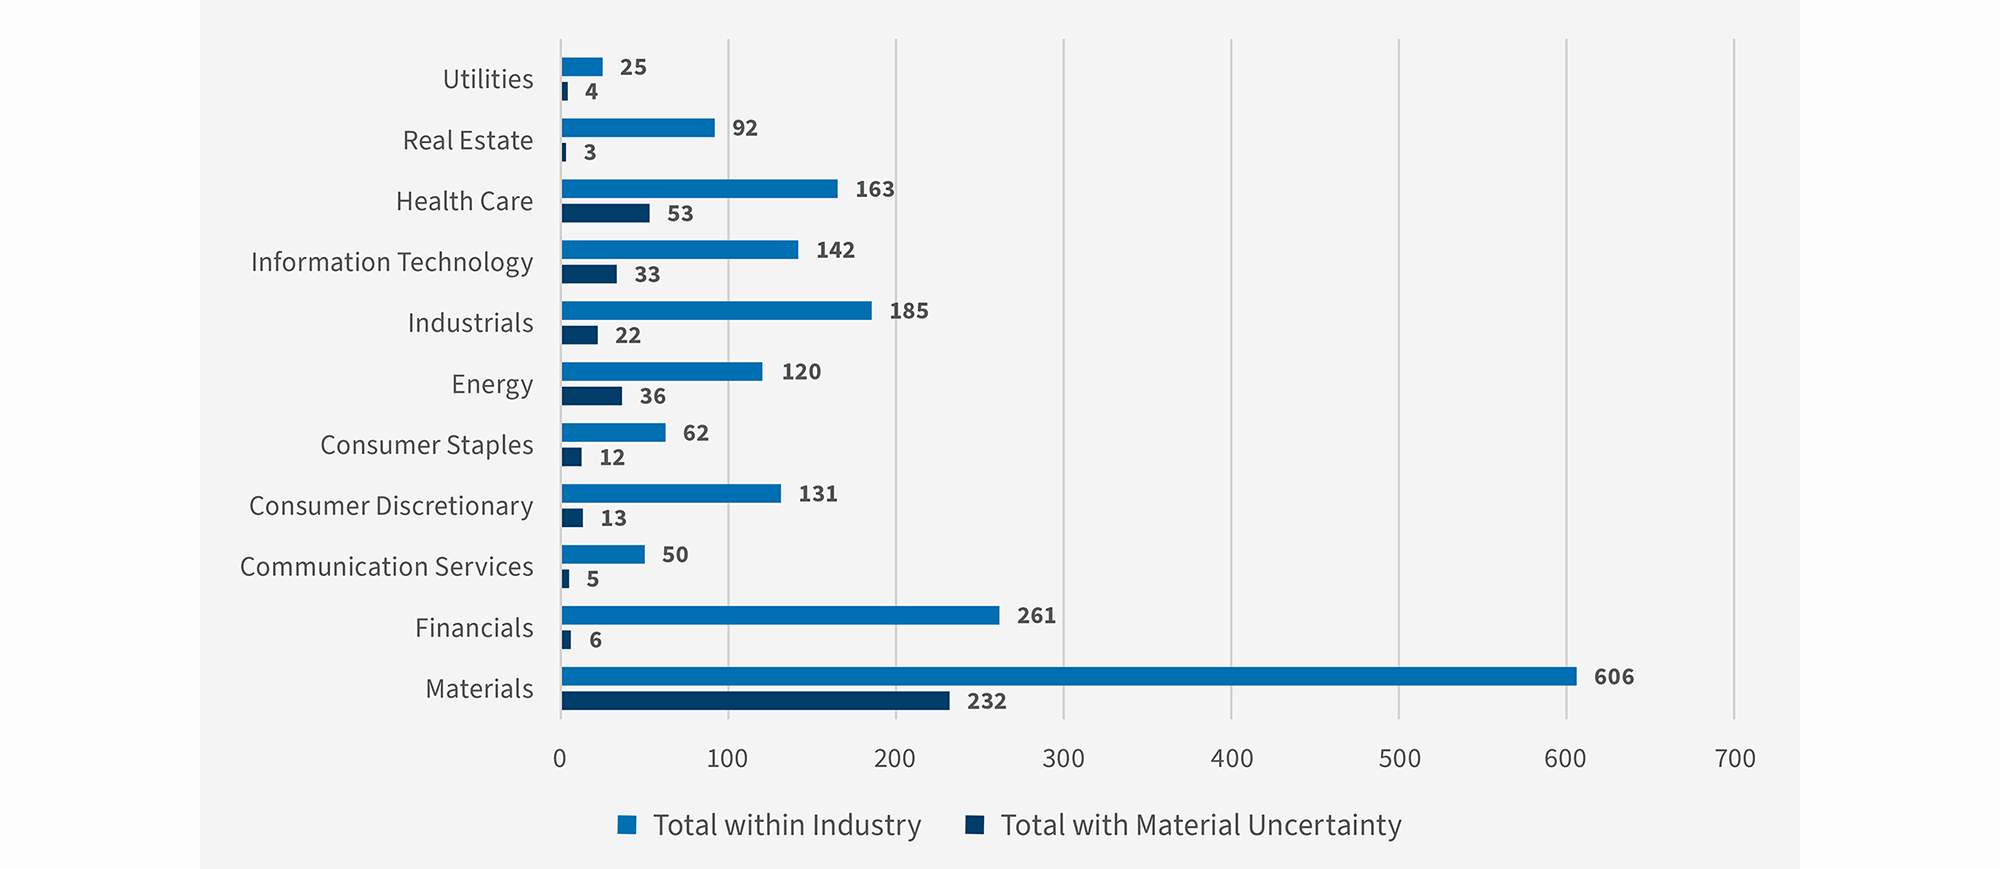
Figure 3 – Companies Reporting Material Uncertainty vs Number in Industry
Industries With Highest Rates of Material Uncertainty
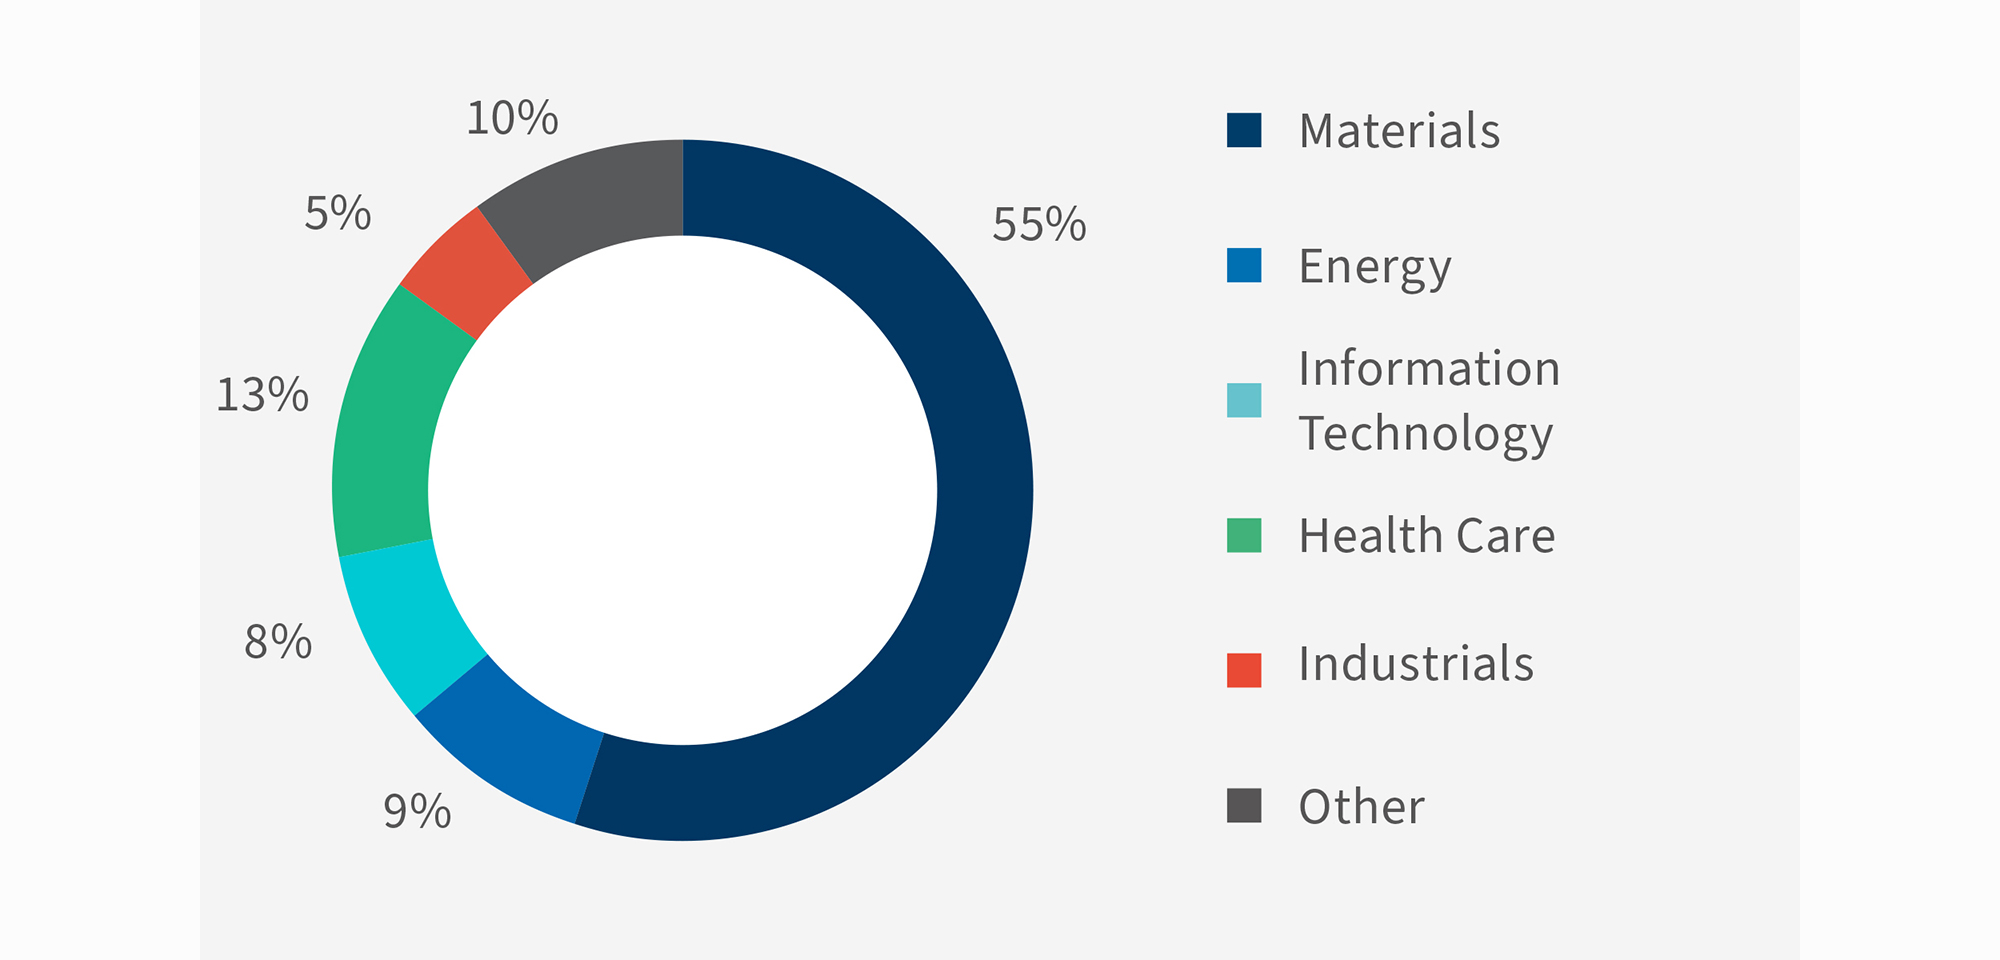
Consistent with calendar year 2024 findings, the materials sector continues to account for a significant proportion of companies reporting a Material Uncertainty. In the current period, 55% of materials sector companies reported a Material Uncertainty, an increase from 42% in 2024. This trend reflects the capital-intensive nature of materials companies, including mining operations, which typically operate on a cycle of sequential capital raises.7
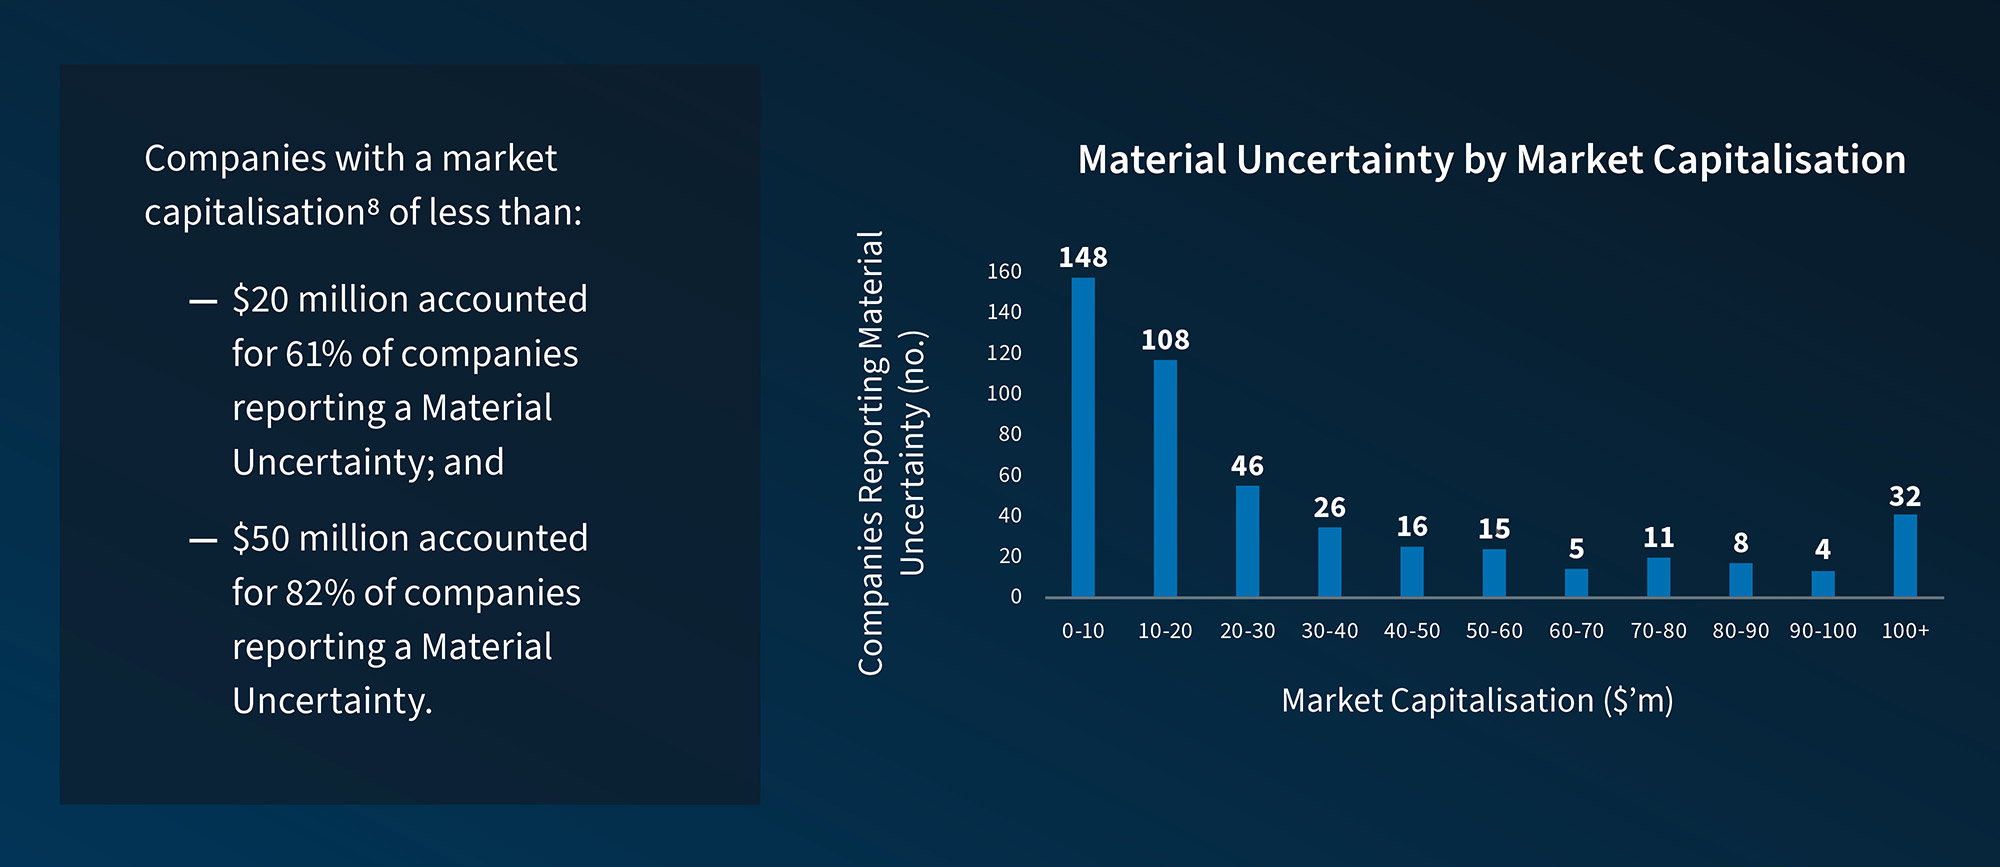
Of the 232 materials sector companies reporting a Material Uncertainty, 72% are headquartered in Western Australia.
Health care and energy are the next largest sectors reporting a Material Uncertainty, with 13% and 9% respectively.
Figure 4 – Material Uncertainty by Sector
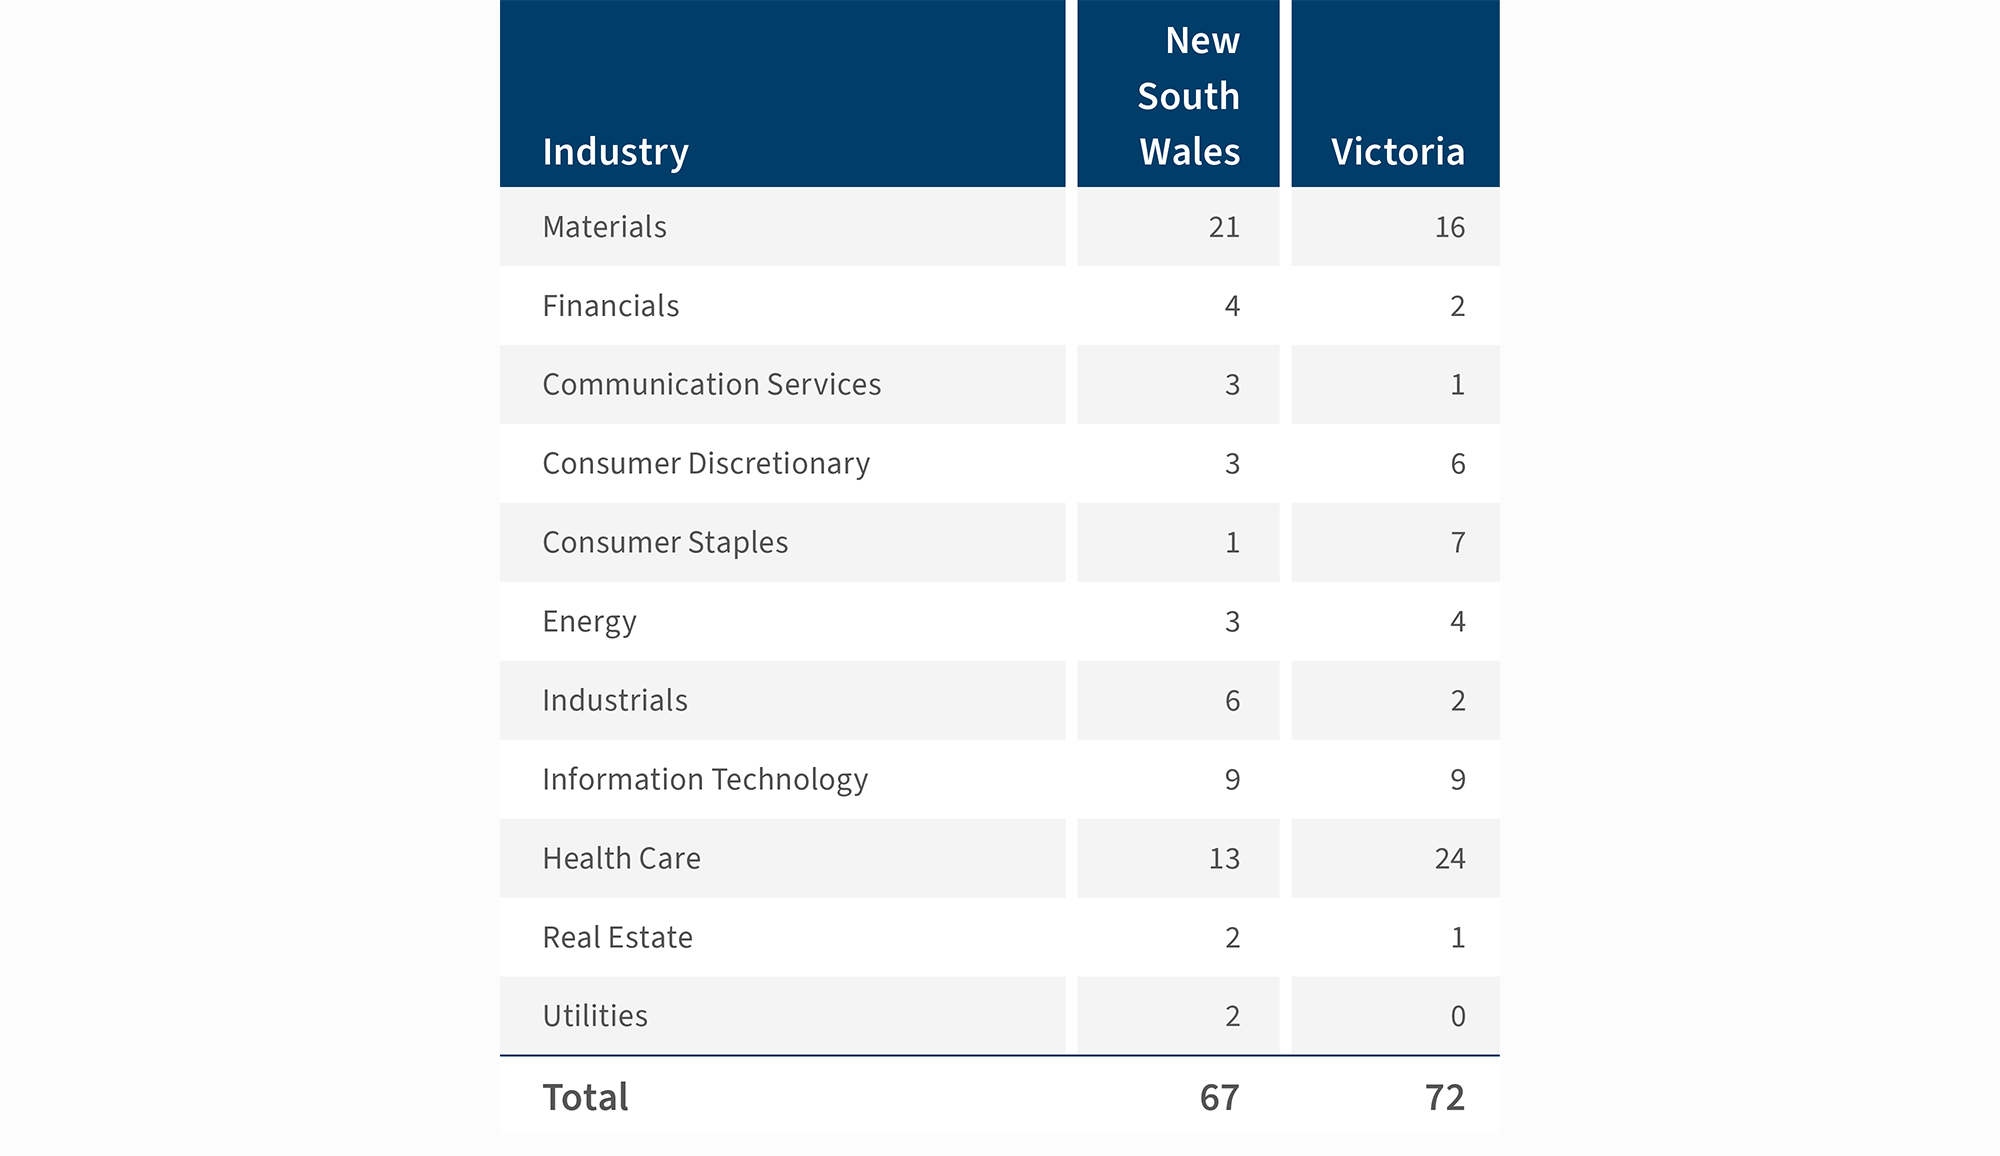
Australia’s Two Largest Economies (Victoria and New South Wales)
Similar to Western Australia, the materials sector accounts for the largest number of companies reporting a Material Uncertainty in New South Wales. In Victoria, however, the health care sector dominates.
Figure 5
Financial Performance
Companies reporting a Material Uncertainty generated total revenue of $6.44 billion for the 2025 calendar year, down 7% from $6.92 billion for 2024. However, the average reported EBITDA declined by 11%.
The average current ratio of companies reporting a Material Uncertainty was 1.8x, indicating short term liquidity is sufficient, on average, to meet current liabilities. However, the average debt to cash and short-term investments ratio was 14.4x, suggesting there may be future issues meeting debt obligations for companies reporting a Material Uncertainty. These findings are consistent with those for calendar year 2024.
Figure 6
Figure 7
How FTI Consulting Can Help
Our experienced team is skilled at engineering and executing formal and informal solutions to maximise value from distressed or insolvent companies – whether providing in-depth turnaround plans to drive value during a restructure, or advising clients in more distressed situations through sales processes or other business exit strategies.
Combining deep sector and industry expertise, our senior leaders and registered liquidators accept formal appointments across Australia and can swiftly mobilise a team on the ground to meet our clients’ urgent needs. We also help directors and companies get ahead of potential issues early by optimising commercial arrangements, accessing safe harbor protections, managing impairment risks, navigating covenant challenges, renegotiating supplier and customer contracts and strengthening stakeholder communications before issues escalate. In all engagements, we bring deep knowledge and experience across regions, geographies and technical capabilities – tailored to the specific challenges facing a business.
View our prior publication dated 15 May 2025 here, in which FTI Consulting analysed all ASX lodgments made from 1 January 2025 to 14 March 2025 relating to the 31 December 2024 reporting period, examining financial performance for the twelve months to 31 December 2024 of companies reporting a Material Uncertainty.
The authors extend their thanks to Daniel Pryce for his contribution to the development of this document.
Footnotes:
1: All information and statistics are derived from Standard & Poor’s Capital IQ and are for the 2025 calendar year.
2: “ASX Listing Rules,” ASX (Chapter 4) and “Corporations Act 2001 (Cth)”, Australasian Legal Information Institute.
3: “Going Concern Standard Approved - Auditing Standard ASA 570 - Going Concern,” Auditing and Assurance Standards Board, Australian Government (28 May 2025), ASA 570 (May 2025).
4: Ibid.
5: Supra, note 2.
6: Based on registered head office location.
7: The observed result in Western Australia is largely attributable to the numerous ASX-listed, pre-revenue small-cap explorers, a sector reliant on capital raises to finance exploration and development activities.
8: As at 24 March 2026.
Related Insights
Related Information
Published
June 26, 2026
 Key Contacts
Senior Managing Director, Head of Australia Corporate Finance
Senior Managing Director
Senior Managing Director
Managing Director
Senior Director