


What’s the State of the Restructuring Market? It Depends Who You Ask
-
October 09, 2026
-

Ask a few restructuring professionals at the larger law firms and advisory shops how business is these days and you’re likely to get mixed responses ranging from “meh” to “busy as hell.” It is a strange time when those immersed in restructuring matters don’t necessarily align on the fundamental strength of their primary business market. Petition, the brutally blunt industry newsletter, has opined of late that advisors claiming to be super busy may be engaging in a bit of hyperbole based on long running work mandates, and that new restructuring activity is middling at best this year and replete with “Sh1tCo cases,” as Petition likes to say.1,2
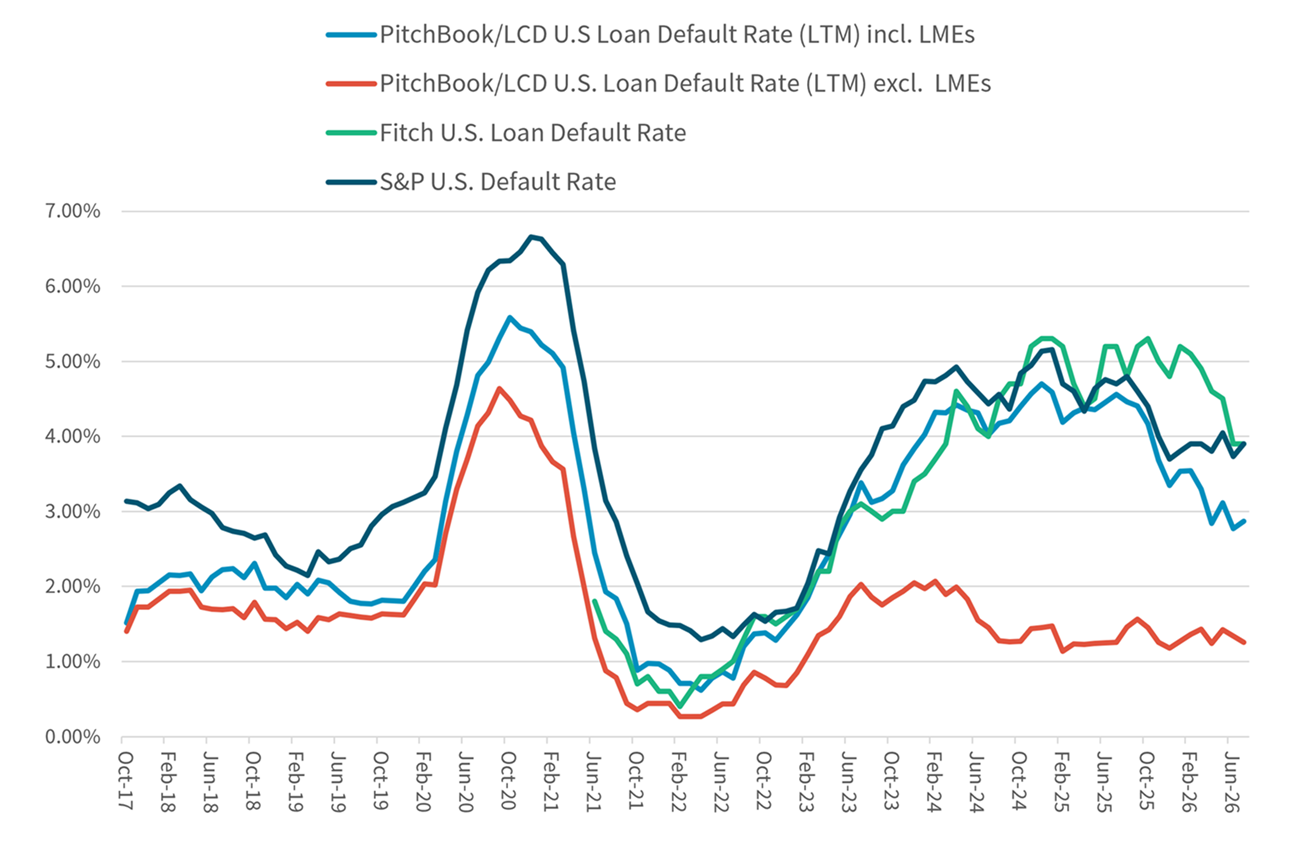
The statistics on such things don’t clarify the matter much. While there are myriad gauges that attempt to measure restructuring activity in a disciplined way, most are giving mixed indications about how robust the market is for corporate stress, distress and failure. The overall takeaway from these metrics (Figure 1): U.S. corporate default rates have eased a bit since mid-2025; they are currently trending slightly lower; but they nonetheless remain appreciably higher than their pre-COVID readings in 2018-2019 and post-COVID lows from mid-2021 through mid-2023. S&P’s current U.S. corporate speculative-grade default rate of nearly 4.0% is consistent with its long-term average.3 Similarly, large Chapter 11 filings (>$50 million) have remained mostly steady and trendless since early 2024 (not shown) at around 150 filings annually, though average filing size has skewed smaller since 2024.4
So, “middling” levels of restructuring activity sounds about right, especially considering the precarious economic backdrop amid times of ratcheting geopolitical risks that might have created expectations of stronger corporate distress than we have experienced in 2026. But some restructuring advisors say they are crushing it while others are busy shaving a couple of strokes off their golf handicap. So where is the action these days? It’s not on the courthouse steps, aside from Houston.
Unfortunately, there is no single index or indicator that truly captures the totality of restructuring activity in all its aspects and settles the debate. Given how much the restructuring market has evolved and stratified in the last decade, it is conceivable that all these varied opinions and indications of market activity are accurate in their own measured way, while the industry lacks a “single source of truth” for capturing and measuring the entire breadth of restructuring activity in all its forms across the corporate landscape and leveraged credit markets.
Figure 1 - Select Corporate Default Rates
Source: S&P Global Credit Ratings, LSEG/LPC, and PitchBook
What Has Changed?
Distressed Debt Exchanges Are the Leading Restructuring Event
In the early days of my advisory career, a restructuring event was nearly always synonymous with a bankruptcy filing. Though out-of-court workouts were done, they weren’t prevalent, while leveraged credit markets and distressed investing were far less evolved. That environment has changed tremendously in recent decades, and the range of capital structure remedies available to distressed companies that constitute a restructuring event has broadened considerably as troubled companies go to ever greater lengths to address and resolve unsustainable capital structure imbalances without resorting to a bankruptcy filing.
The primary alternative to bankruptcy is a Distressed Debt Exchange (“DDE”) with creditors, a financial remedy that has been around for decades but is now utilized more than ever by struggling companies as a stopgap measure. DDEs often are referred to as coerced exchanges, as the issuer typically holds out the specter of a Chapter 11 filing as an inducement to encourage creditors’ cooperation. A DDE usually results in a debt maturity extension, some principal reduction, coupon relief, covenant relaxation and/or distressed debt repurchases below par. DDEs typically require overwhelming support from impacted creditors — at least a supermajority and often near unanimity — as dictated by underlying credit documents, before they can be enacted and cannot be imposed on creditors by the issuer without reaching requisite consent levels. Credit rating agencies almost always consider a DDE to be a debt default event provided that the revised economic return to impacted creditors is worse than what they originally contracted for, which is usually the case. Consenting creditors expect that the relief provided by a DDE will allow the issuer to get through a rough patch and eventually make them whole or close to it, though the track record on DDEs indicates a sizeable share of them will default again in some form within two to three years. According to S&P, DDEs have accounted for approximately 50% of all rated U.S. corporate default events for three consecutive years — more than missed payments and bankruptcy filings combined — compared with 32% from 2010-2023. The percentage of S&P rated U.S. corporate default events attributable to DDEs has shown a steady upward trajectory since the end of the global financial crisis in 2009.5 Similarly, Fitch Ratings data indicates that nearly 60% of defaulted U.S. leveraged loans since early 2024 were distressed exchanges.
Unlike bankruptcy filings, which are discrete events that are publicly reported and easy to track and tabulate, DDEs can take on several forms and are not as easily defined, observed and measured, especially if the issuer does not have debt rated by a major credit rating agency. Middle market companies without rated debt, especially those financed by private credit sources, can more easily engage in de facto DDEs that fly under the detection radar of those who track such things, which would lead to undercounting of relevant default events.
Liability Management Transactions Add to the Out-of-Court Tally
Beyond conventional DDEs, Liability Management Transactions (“LMTs” or “LMEs”) have emerged as another alternative to a bankruptcy filing in the last decade, primarily by sponsor-owned companies. LMTs typically exploit loose or permissive drafting language in loan documents regarding investment baskets to move assets out of the reach of secured lenders and use that released collateral to raise new capital, often from splintered groups of existing lenders. LMTs can take on many forms and features but typically divide extant creditor groups via non-pro rata offerings or holdout creditors. Unlike conventional DDEs, which require a very high percentage of consent from impacted creditors, borrowers often can exploit loan document language to get large (and favored) creditor blocs to change voting requirement thresholds and implement an LMT with a simple majority of consenting lenders, often pitting similarly situated lenders against each other — hence the clunky “lender-on-lender violence” moniker for LMTs. Moreover, LMTs are used for capital raising purposes more than DDEs, which tend to push out maturities, provide interest relief and/or reduce outstanding principal. Data from Octus indicates there have been 124 LMTs it has documented from 2023-1H26, while Debtwire reports 213 LMTs since 2020.6 These are significant numbers — averaging about 40 U.S. based LMTs annually in recent years — that have provided a financial lifeline to large, distressed issuers and likely averted a Chapter 11 filing, at least for a while.
LMTs can be considered a subset of DDEs. To the extent that an LMT is completed by a rated issuer, the rating agencies very likely will consider the transaction to be a default event, though there are rare exceptions when the plain language of the credit documents permits the transaction and the expected economic returns to creditors are not considered impaired based on the new securities package.
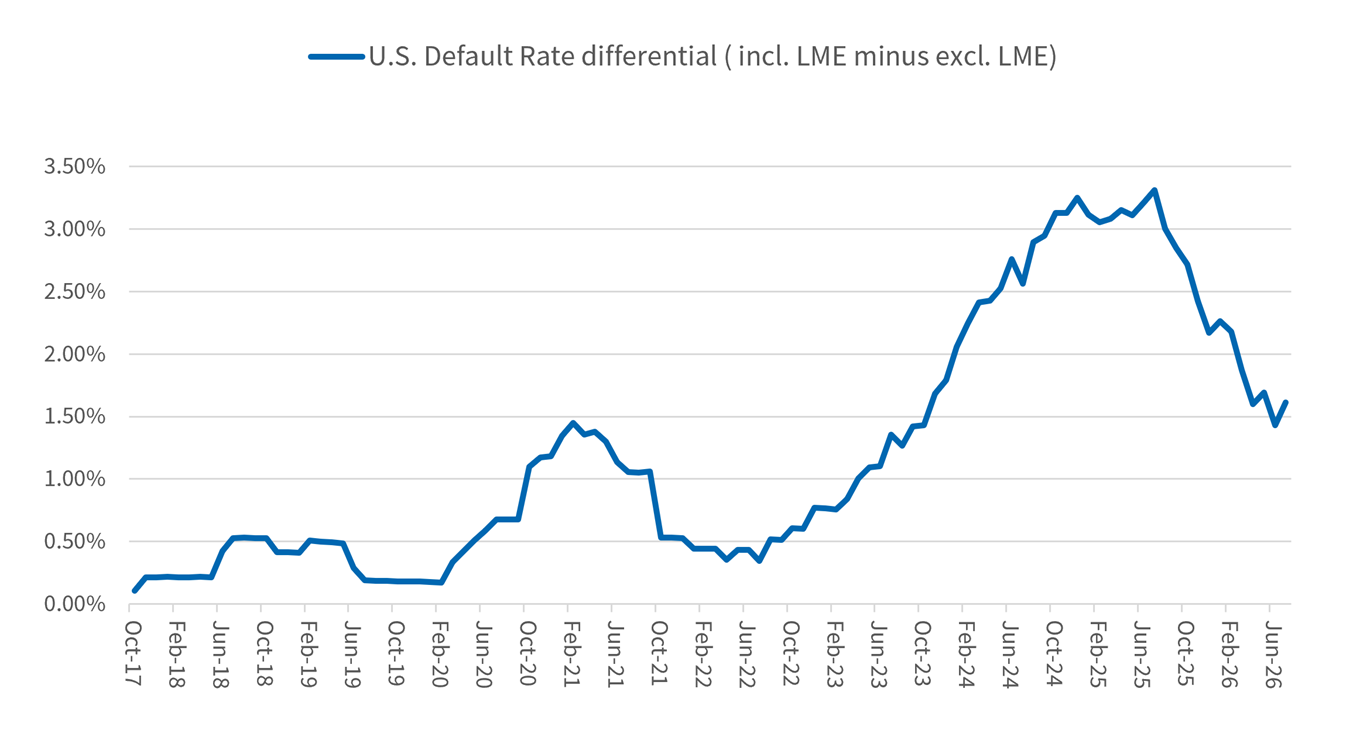
U.S. leveraged loan default rates calculated by PitchBook are measured with and without counting LMTs (Figure 1), and Figure 2 depicts how materially LMTs have impacted the loan default rate in recent years, going from negligible in 2019 to peak impact in mid-2025 before easing since then.
Figure 2 - U.S. Corporate Loan Default Rate With and Without LMEs
Source: PitchBook
Tracking Private Credit Defaults Is Uniquely Challenging
Direct lending from private credit funds has become a formidable force in leveraged finance since 2015, with estimates of the asset class size ranging from $600 billion to more than $1 trillion, depending on exactly what is being measured.7,8 Monitoring loan performance and default events and estimating a default rate for private credit markets can be especially challenging and nuanced given its statistical opacity compared with the high-yield and broadly syndicated loan (“BSL”) markets, and default rate estimates for private credit markets can vary notably among those who attempt to track it. Fitch Ratings recently reported its U.S. private credit default rate was 6.0%9 at mid-year (and ticked up to a record-high 6.1% in July),10 which is a blended estimate of its rated and monitored private loans, with the default rate of the monitored loan group being approximately 350 basis points higher than its rated loans with a credit opinion. S&P’s U.S. credit estimate default rate — arguably a proxy for private credit defaults — was just 0.85% at 2Q26 but jumped to 3.9% when selective defaults (mostly for payment in kind (“PIK”) interest toggles) were included,11just 25 basis points higher than the comparable default rate for its rated U.S. speculative-grade universe. The default rate of Proskauer’s U.S. private credit index of more than 700 loans and nearly $200 billion of originated principal was just 2.51% through 2Q26.12 Lincoln International pegged the private credit default rate at 2.7% at mid-year based on loan covenant default events, but that soared to 6.2% when loans that added a PIK interest rate option subsequent to issuance (“shadow defaults”) were included in its calculation.13 Most recently, PIMCO estimated a shadow default rate for business development company (“BDC”) loans (the most public subset of direct lenders) by including all events it considered tantamount to default, which indicated a shadow default rate in the mid-teens that has been trending higher since 2022.14
In short, these default rate estimates are all over the place, not because some are better or worse than others but because they are not all measuring the same thing in the same way. Since there is no definitive source for private credit performance and default data, users are left to decide which gauge they find most relevant to their segment of interest.
It is difficult to make sense of these often-wide-ranging default estimates, and there is still considerable debate in leveraged lending circles as to whether private credit underwriting standards, loan monitoring and, ultimately, loan performance are comparable to those in the broadly syndicated loan market. Opinions on this issue differ starkly between traditional bank lenders and private credit advocates who argue that recent concerns about private credit lending practices, industry exposures, loan portfolio performance and liquidity adequacy are wildly overblown. Only time will settle this debate.
LMTs Are Also Skewing Advisor Mandates
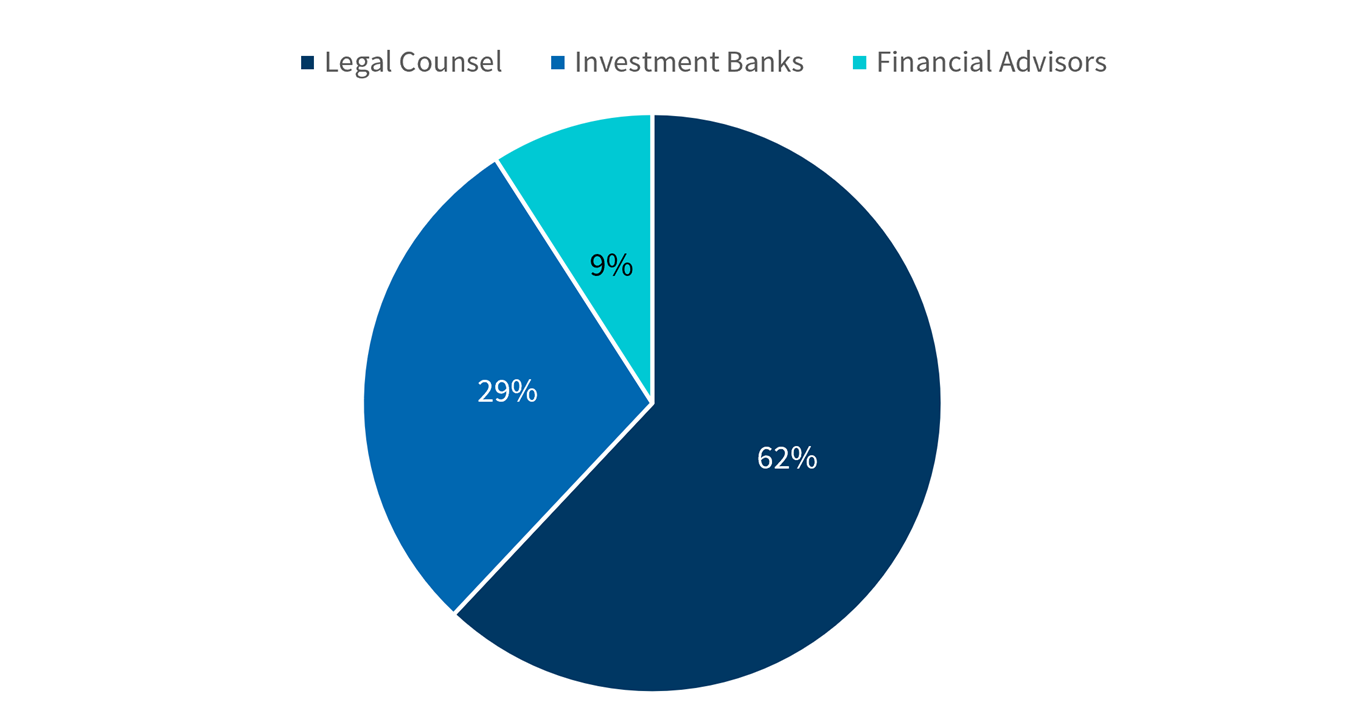
The prevalence of LMTs since 2020 has had a material impact on restructuring work and advisor mandates, primarily by averting or deferring bankruptcy filings but also by shifting typical mandate assignments. LMTs are advisor-intensive transactions, as various creditor groups who are parties to these complex and often contentious deals often engage their own advisors. However, LMTs primarily are exercises in intense legal negotiations, and LMT mandates overwhelmingly engage legal advisors, mostly Big Law, often to the exclusion of other advisors. The data bears this out: FTI Consulting’s evaluation of LMT data since 2023 from Octus indicates that more than 60% of total advisor mandates in these 124 deals went to legal counsel (Figure 3). Moreover, for LMTs in which an investment bank or financial advisor was engaged, more than 75% of those mandates went to investment banks. Lastly, of the nearly 10% of LMT mandates that went to traditional financial advisors, 53% went to the Top Three advisors.
This mandate allocation is a huge contrast to in-court cases, where traditional financial advisors have garnered a majority of non-counsel mandates in recent years compared with investment banks. Lastly, it’s safe to assume that mandate allocations for the wider cohort of DDEs that aren’t LMTs follow a similar pattern that highly favors legal counsel and investment banker mandates.
Figure 3 - % of LMT Mandates: 2023-1H26
All Parties including Ad Hoc Groups
Source: Octus and FTI Consulting Analysis
The View Depends on Where You’re Standing
It is of course entirely possible that restructuring advisors are experiencing this market in very different ways, mostly due to the prevalence of DDEs and LMTs, the skewedness of these typical mandate hires and the avoidance of formal Chapter 11 filings — at least for a while — with many mid-tier legal and advisory shops still watching this play out from the sidelines. However, as more of these out-of-court restructurings prove to be short-lasting fixes that later will end up in a courthouse, there is heightened expectation that the left-behinds will get in the game and see more playing time. But for now, it’s a waiting game.
Footnotes:
1: Crap Cases Crash into Court, Petition, August 2, 2026.
2: I’m super crazy busy…, Petition, July 19, 2026.
3: Credit Conditions: Credit Conditions & Outlook North America Q4 2026: Risk Trifecta: War, AI, Rates, S&P Global, September 24, 2026.
4: Default, Transition, and Recovery: U.S. Default Rate Forecast To Stabilize At 3.75% By June 2027, S&P Global, August 20, 2026.
5: Default, Transition, and Recovery: Distressed Exchanges Reached Their Highest Level Since 2009, S&P Global, August 15, 2024.
6: Liability Management Exercise Report 2020 – YTD 2026, Debtwire, August 19, 2026.
7: Private Credit: Characteristics and Risks, Federal Reserve Board, February 23, 2024.
8: Federal Reserve Banks of Dallas and New York to Launch Pilot Survey of the Private Credit Market, Federal Reserve Bank of New York, August 5, 2026.
9: U.S. Private Credit Default Rate Reaches New High in 2Q26, Fitch Ratings, July 30, 2026.
10: Fitch Ratings’ U.S. Private Credit Default Rate Remains at Record High in July 2026, Fitch Ratings, August 13, 2026.
11: Signs of Strength and Signs of Tension Persist in Private Credit, S&P Global, August 13, 2026.
12: Proskauer’s Private Credit Default Index Reveals Rate of 2.51% for Q2 2026, Proskauer, July 28, 2026.
13: Private Credit Defaults Reach New High While Workouts Increasingly End with Lenders as New Owners, Andrew Hedlund, CreditSights, a Fitch Solutions Company, August 20, 2026.
14: The Credit Market Lens: Narrowing the Visibility Gap in Defaults, Lotfi Karoui, PIMCO, August 24, 2026.
The views expressed herein are those of the author(s) and not necessarily the views of FTI Consulting, Inc., its management, its subsidiaries, its affiliates, or its other professionals.
Related Insights
Published
October 09, 2026
 Key Contacts
Global Chairman of Corporate Finance