


Closing the Execution Gap to Unlock Value Creation
How Private Equity (“PE”) Investors Can Surf the Next Wave of Value in Consumer Packaged Goods (“CPG”) and Retail
-
October 02, 2026
Downloads Download Article
-

FTI Consulting’s 2026 Private Equity Value Creation Index points to a specific opportunity for Consumer Packaged Goods and Retail investors: the biggest value-creation gains sit not in de-novo strategies, but in clearly and systematically closing gaps between investment thesis priorities and where execution tends to fall short.1
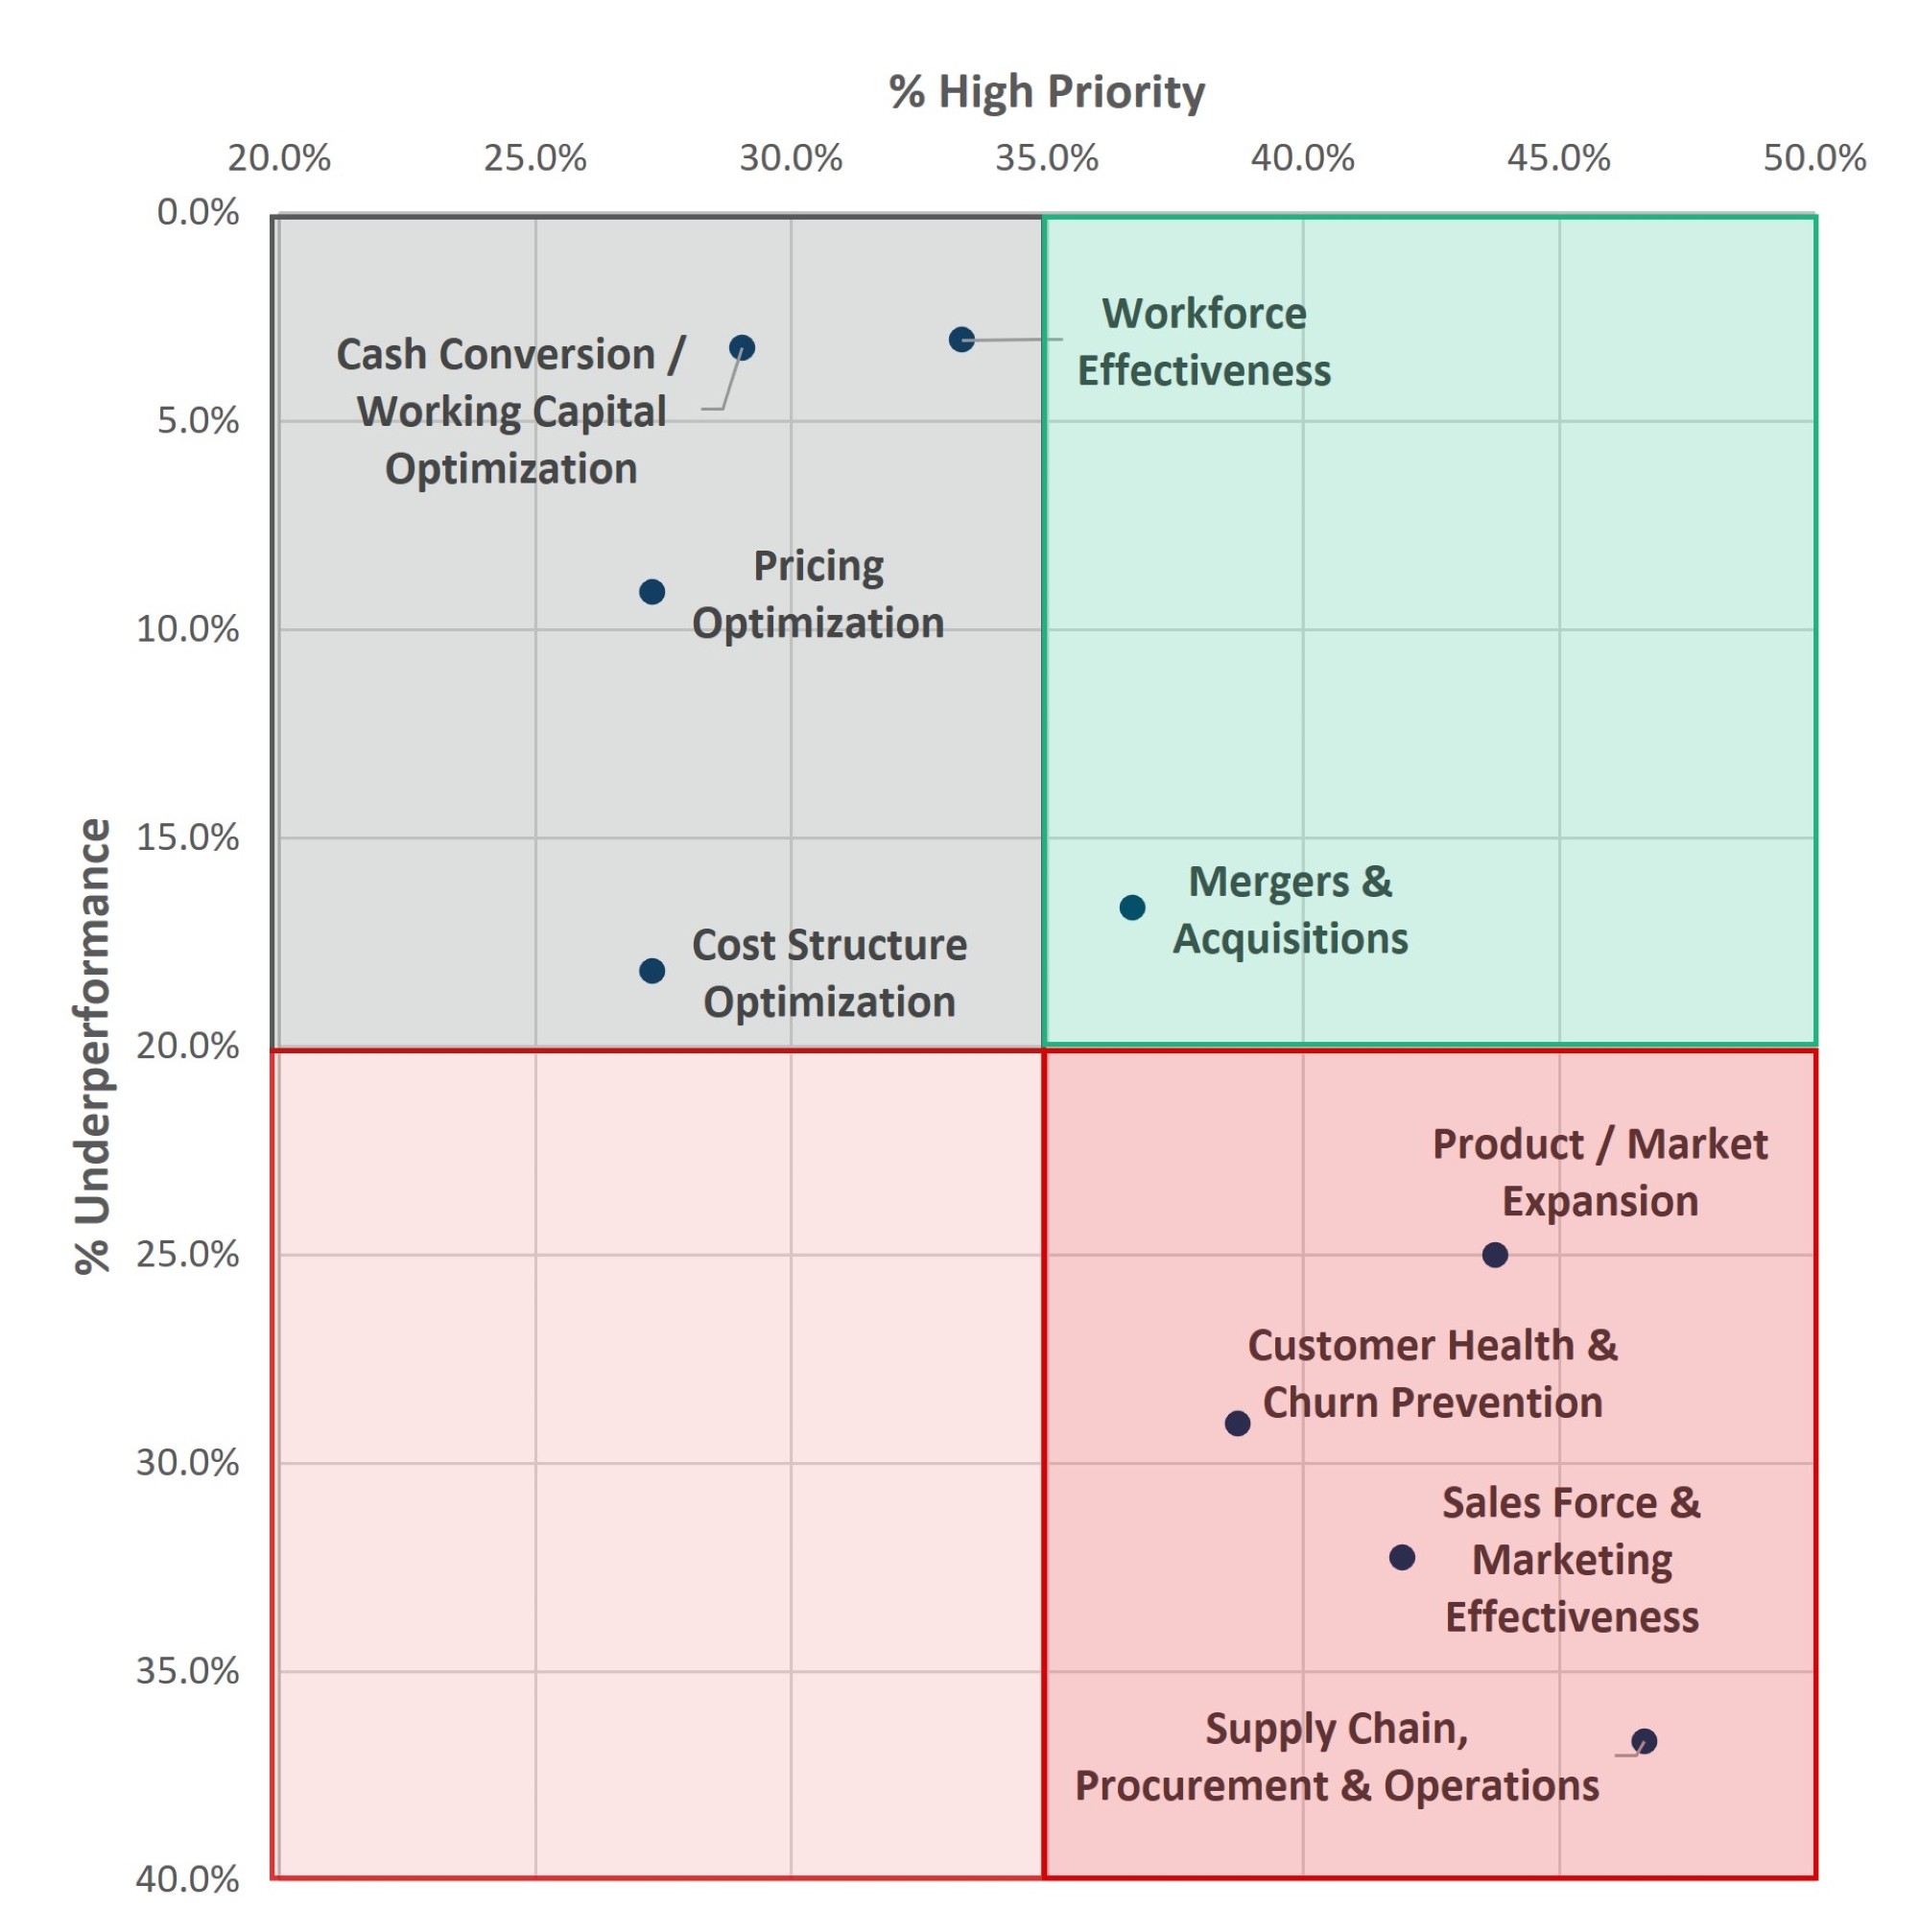
Retail portfolio companies (“portcos”) offer the clearest example of this opportunity. Supply Chain, Procurement & Operations has jumped from #7 in perceived value in FTI Consulting’s 2025 survey to the #1 priority in the 2026 iteration — despite a 37% historical miss rate against internally defined business cases. CPG portcos show a different version of the same dynamic, with investors balancing margin protection and growth, and driving cost structure optimization while continuing to focus on pricing, customer health and commercial execution.
While the playbooks are clearly distinct, the value creation thesis is shared, and identifying the right lever is only the starting point. The opportunity lies in closing the execution gap, and doing so with the speed and discipline required to capture value during the hold period.
Retail: Scale the Growth Engine, Build Deal Muscle
That shift makes supply chain the clearest proxy for Retail’s broader challenge: growth is available, but value depends on execution.
Figure 1 – Retail Value Creation Levers, Priority and Relative Performance
1) Findings representative of surveyed sample of n=34 (Retail).
2) Rankings based on the number of “high” priority votes (defined as rankings 1–3).
The widest gaps — supply chain, product expansion, customer health — should expect the most underwriting scrutiny and are where the biggest execution payoff lies.
Retail investors are increasingly focused on availability, fulfillment, procurement and operational execution because these capabilities determine whether growth translates into profitable, scalable performance.
Consumer/retail sponsors rank procurement and supply chain among their top three value creation priorities, yet these are consistently among the lowest-performing functions post-close. That’s not a coincidence; it’s a signal that most portfolio companies treat supply chain as a cost center to manage rather than a value lever to engineer.
Maverick spend, rebate mismanagement, working capital trapped in inventory and demand-supply mismatch — all of these tend to accumulate leakage in this sector. Based on FTI’s experience consulting with clients in this area, these individually immaterial items can collectively account for 200-400bps of trapped EBITDA in a typical mid-market consumer/retail platform.
Where the leakage actually hides:
- Procurement: spend under management, not merely spend under contract. Most portfolio companies have contracts in place but no compliance mechanism. Maverick buying, off-contract purchasing, and rogue SKUs at the category level can, in the experience of FTI Consulting, erode 3-8% of addressable spend even when “strategic sourcing” has technically been done.
- Rebates, allowances and vendor funding left on the table. Consumer/retail is unique in how much value sits in trade terms, co-op marketing dollars, and volume rebates, and most mid-market companies don’t have the systems to track, claim or audit them. This is often the single largest quick-win category in a 100-day plan.
- Inventory as a working capital sink. Overstocked slow movers and understocked fast movers coexist in the same warehouse because sales and operations planning (“S&OP”) is a spreadsheet exercise and not mission-driven. The result: working capital is tied up in the wrong SKUs while stockouts still drive lost sales.
- Supplier concentration and risk that impact operations in a structurally more risky operating environment. Tier 1 supplier maps exist; tier 2 or 3 maps usually don’t. Tariff exposure, single-source dependencies and geographic concentration are underwritten diligence items that get deprioritized post-deal, leaving the business exposed to geopolitical and tariff disruptions.
- Logistics and freight: paying retail rates at wholesale volume. Freight and logistics contracts are frequently inherited agreements, fragmented across carriers/modes and not benchmarked, especially in platforms built through buy-and-build. In such an environment, consolidation and mode optimization could be a 5-10% freight cost opportunity that nobody owns. How often are you revisiting your carrier contracts?
- Data and visibility gaps between procurement, planning and finance can be leading drivers of leakage. These functions often exist in silos with different systems of record, lacking a shared source of truth. Procurement doesn’t see demand signals, planning doesn’t see supplier risk, finance doesn't see either until in such an environment the profit and loss (“P&L”) statement reflects it. This is often the root cause underneath most of the leakage above; it’s a systems and governance problem before it’s a cost problem.
Similar patterns extend beyond supply chain. Product and Market Expansion ranks #2 for 2026 in the survey, while Sales Force & Marketing Effectiveness and Customer Health & Churn Prevention also rise on the reported agenda despite historical execution gaps.
At the same time, some proven levers are becoming more mature. Cash Conversion & Working Capital Optimization has only a 3% historical underperformance rate in Retail, making it a highly reliable source of liquidity, yet in the 2026 survey, it falls from #2 in perceived value to #7 in priority. The takeaway is not that working capital matters less; rather, investors are increasingly looking beyond mature efficiency levers toward opportunities that can unlock the next stage of growth.
Retail also faces a distinct execution challenge around mergers and acquisitions (“M&A”). M&A ranks #9 in perceived value in the 2026 survey, with a 17% underperformance rate, pointing to the need for stronger deal and integration capabilities where buy-and-build strategies are part of the value-creation thesis. Despite ranking last in perceived value, M&A rises to #5 among Retail’s 2026 priorities — a four-place shift — and 76% of Retail respondents already apply the lever sometimes or very often.
However, conversion is a likely constraint. Only 33% of Retail respondents in the 2026 survey describe M&A as very or mostly easy to implement, and just 30% of its value lands in the first year, with the remaining 70% realized beyond it — the slowest payback profile of any lever (for Retail investors). It also raises a sequencing question, because Retail’s most dependable lever is also its fastest — cash conversion and working capital carries only 3% underperformance with 84% of value inside year one, and can fund deal-driven growth while the integration curve plays out.
CPG: Protect the Margin Core, Fix the Growth Engine
CPG investors report balancing margin protection with a renewed push for growth. In the 2026 survey, Cost Structure Optimization is the #1 priority for 2026, while pricing, customer health and product/market expansion remain important opportunities. However, several of these growth levers have historically underperformed against their business cases.
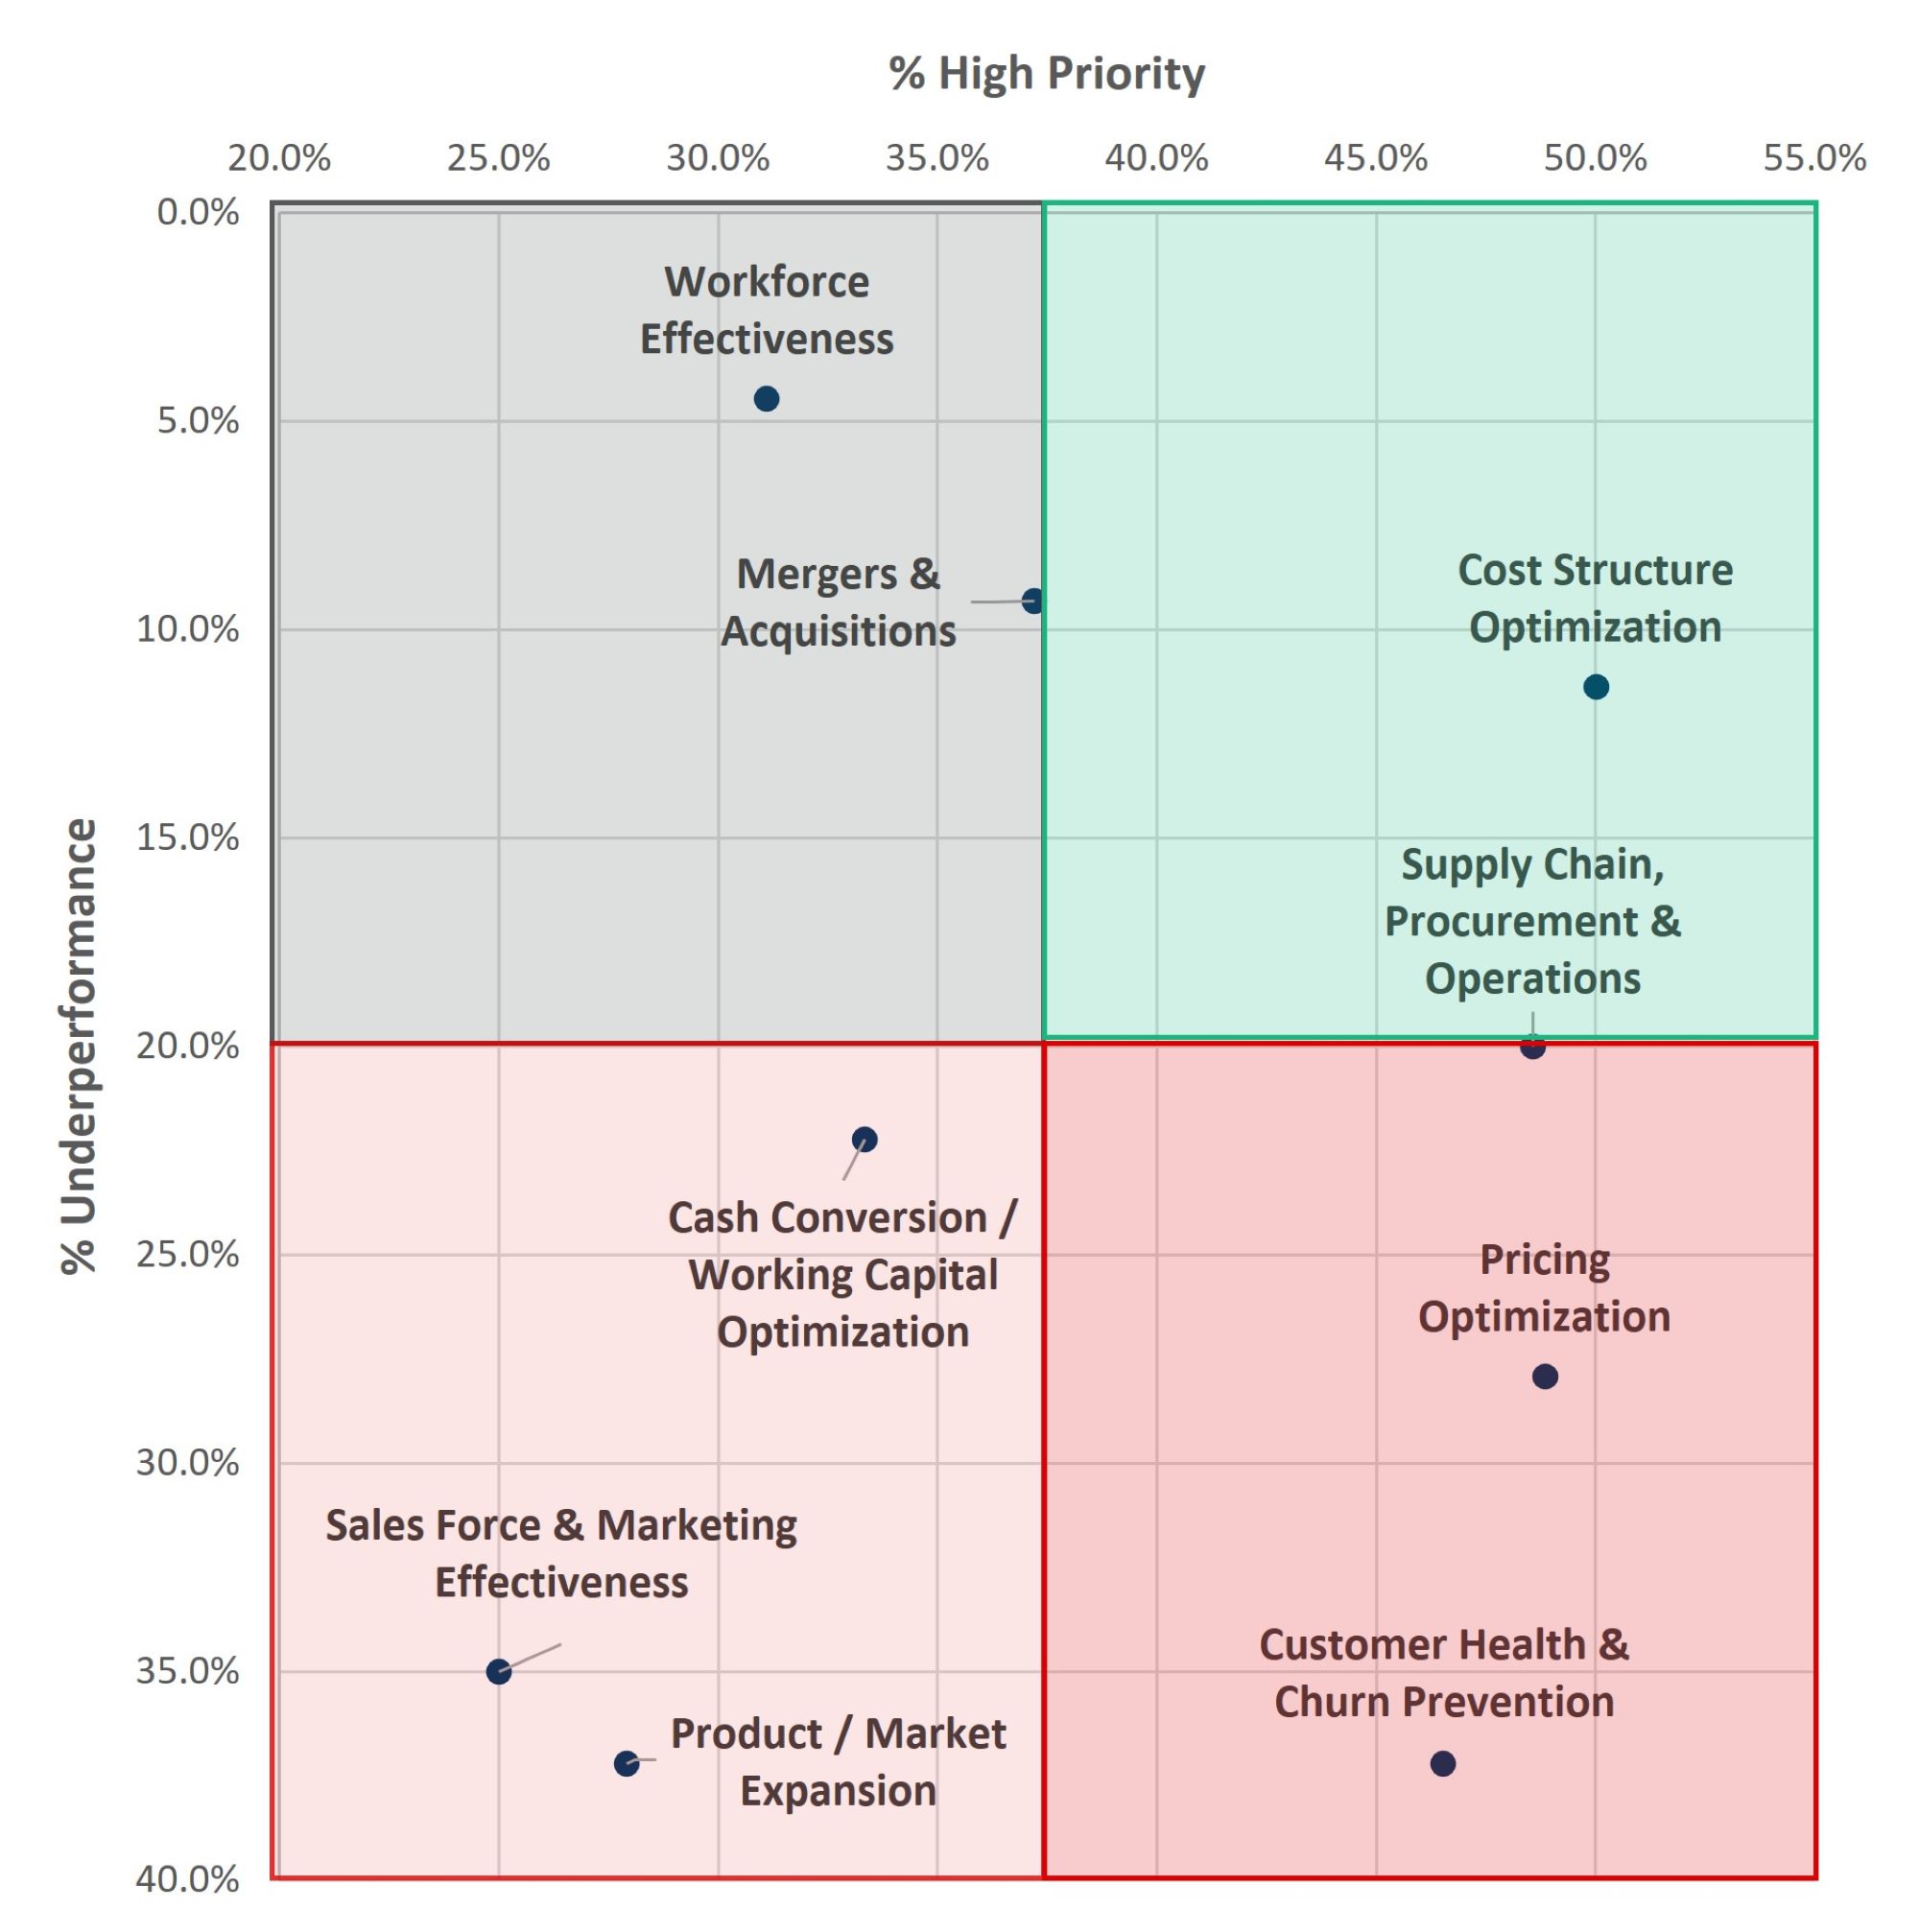
Figure 2 – Consumer Packaged Goods (“CPG”) Value Creation Levers, Priority and Relative Performance
1) Findings representative of surveyed sample of n=48 (“CPG”).
2) Rankings based on the number of “high” priority votes (defined as rankings 1–3).
The chart highlights the CPG tension: investors are prioritizing margin and commercial levers, but the biggest upside depends on improving execution against pricing, customer health and market expansion.
At the same time, Pricing Optimization remains CPG’s #1 perceived-value lever and #1 AI use case, with 79% of CPG respondents reporting realization within the first year, and 70% describing the lever as very or mostly easy to implement. The opportunity is significant, but historical execution has been uneven — respondents indicate that pricing carries a 28% miss rate against business case in CPG, the widest of CPG’s three top-ranked value levers.
The same tension appears across the broader growth engine. Product and Market Expansion and Customer Health & Churn Prevention each show 37% historical underperformance, even as both become increasingly important to CPG investors. Sales Force & Marketing Effectiveness also remains an execution challenge.
For sponsors, the opportunity is therefore not simply to identify another growth initiative. It is to close the quality-of-revenue gap — establishing the data, commercial discipline and management accountability needed to distinguish sustainable growth from temporary uplift.
Three moves to consider for PE sponsors:
- Sequence by payback rather than by ambition. 86% of CPG respondents in the 2026 survey report first-year realization on cash conversion and 79% on pricing, against 47% on product and market expansion — so rapid, reliable levers should be funding the harder growth build.
- Run pricing as a managed system rather than an annual exercise. Pricing should pair price architecture with promotional effectiveness and revenue growth management to address the execution gaps reflected in the 28% historical miss rate.
- Give customer health the same operating discipline as new-customer growth through structured key-account health and churn programs. Expansion is the standout capability gap and should be treated as a build, not a push: across all survey respondents it is the #2 priority for 2026 but only #9 in AI usage, and only 37% of CPG respondents call it easy to implement.
That distinction matters beyond the hold period. For CPG respondents, the strength and scalability of the revenue model is the top factor in exit readiness, reinforcing the importance of building a revenue engine that buyers can understand, underwrite and believe will endure.
What This Means for Sponsors
The implications extend across the investment lifecycle. What PE teams look for at exit sets the agenda for each sector.
Retail respondents rank market positioning and competitive differentiation first (68%, against 48% overall) and put revenue scalability third at 41%, so the Retail plan has to evidence a defensible category and channel position.
CPG respondents rank the strength and scalability of the revenue model first (67%, against 54% overall), so the CPG hold-period plan has to generate evidence of revenue repeatability.
One constraint applies to both: only 33% of CPG and Retail respondents report extensive, deeply embedded operations teams, and 49% exceeded their business case over the past 12 months. Where sponsor-side capacity is thin, closing these gaps is a resourcing challenge.
In Retail, operational readiness should be part of the investment thesis from the start. Supply chain, procurement, inventory, fulfillment and commercial execution should be assessed as core value-creation capabilities — not post-close cleanup items. For sponsors pursuing buy-and-build strategies, deal execution and integration should receive the same scrutiny.
In CPG, diligence should pressure-test the quality and durability of revenue. Pricing power, promotional effectiveness, customer health, channel economics and revenue growth management should be evaluated not only for upside, but for how repeatably management can execute against the thesis. The goal is to build an investor-ready revenue model that demonstrates repeatability, scalability and margin durability.
Across both sectors, execution should start earlier. The most attractive opportunities are increasingly found in the gaps between strategic intent and realized performance. Sponsors that identify those gaps during diligence can enter the hold period with clearer priorities, defined ownership and a more credible path to value. As the Index shows year over year, the sponsors who close these gaps first — not just identify them — will be the ones who capture the next wave of value in CPG and Retail.
Source: FTI Consulting 2026 Private Equity Value Creation Index, based on a survey of 555 senior PE leaders globally, including 48 CPG and 34 Retail respondents. CPG and Retail findings should be viewed as directional given the size of the sector-specific samples.
Footnotes:
1: FTI Consulting, Inc., “Private Equity Value Creation Index 2026: The Value Creation Edge” (2026). Unless otherwise indicated, all data detailed in this article is based on responses received to the 2026 FTI Consulting survey of 555 senior leaders worldwide, which responses were compiled for the Private Equity Value Creation Index 2026.
The views expressed herein are those of the author(s) and not necessarily the views of FTI Consulting, Inc., its management, its subsidiaries, its affiliates, or its other professionals.
Related Insights
Published
October 02, 2026
 Key Contacts
Managing Director
Managing Director
Senior Managing Director, Co-Leader of U.S. Business Transformation
Senior Managing Director
Senior Managing Director, U.S. Leader of Commercial Due Diligence